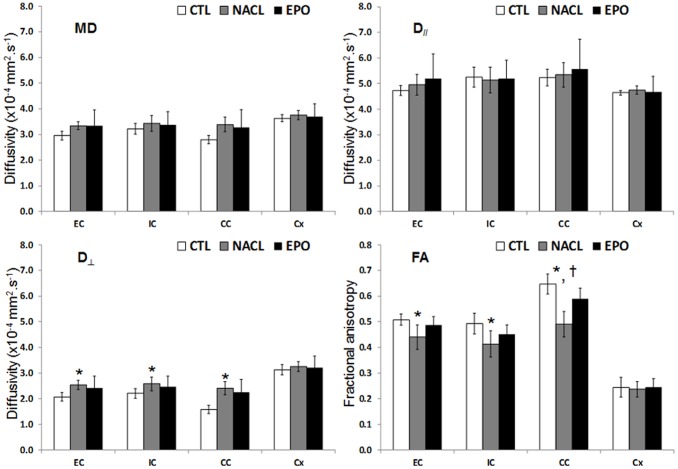
Figure 7. Microstructure assessment with DTI.
Histogram of diffusivities (Mean: MD, axial: D//and radial: D⊥) as well as fractional anisotropy (FA) values ± SD measured in the in the external capsule (EC), internal capsule (IC), corpus callosum (CC) and cortex (Cx) of the EPO, NaCl and Control rats (n = 6 rats for each group, NaCl, EPO and Control, mean values over the four different images planes corresponding to the one of the figure 6; *, ‡, †: P<0.05 NaCl vs. Control, EPO vs. Control and EPO vs. NaCl, respectively).

