Figure 1.
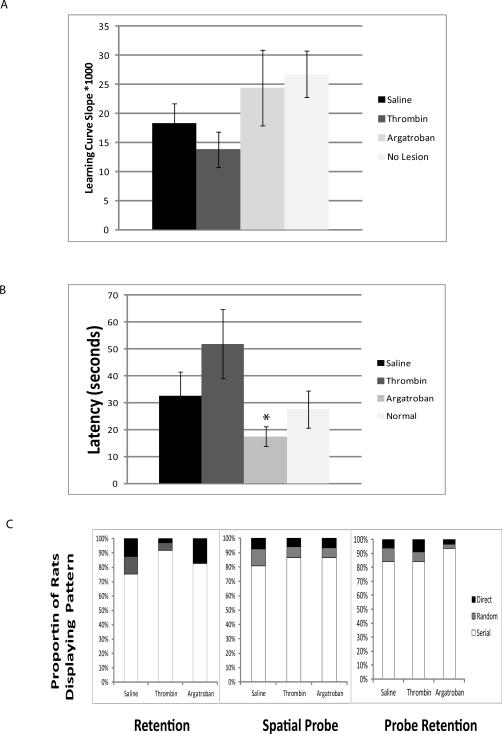
A. Learning Curves. Over 5 days in the Barnes Maze, each animal learned the location of the escape hole. The linear learning curve—the inverse of the mean latency-to-escape on each day—was highest in the ‘no lesion’ controls and slowest in the thrombin group (p=0.03, ANOVA, Tukey's). B. Spatial Probe Escape Latency. The spatial probe assesses the time to locate a new escape location. Saline and thrombin prolonged the time to locate the new escape location1. Argatroban ameliorated this effect (* p<0.05 compared to thrombin treatment). C. Search Strategy. The proportion of searches characterized as direct, serial or random are shown during the retention, spatial probe, and probe retention tests, without error bars for clarity. Argatroban treated subjects used fewer random searches in the retention task (p<0.03, Chi Square).

