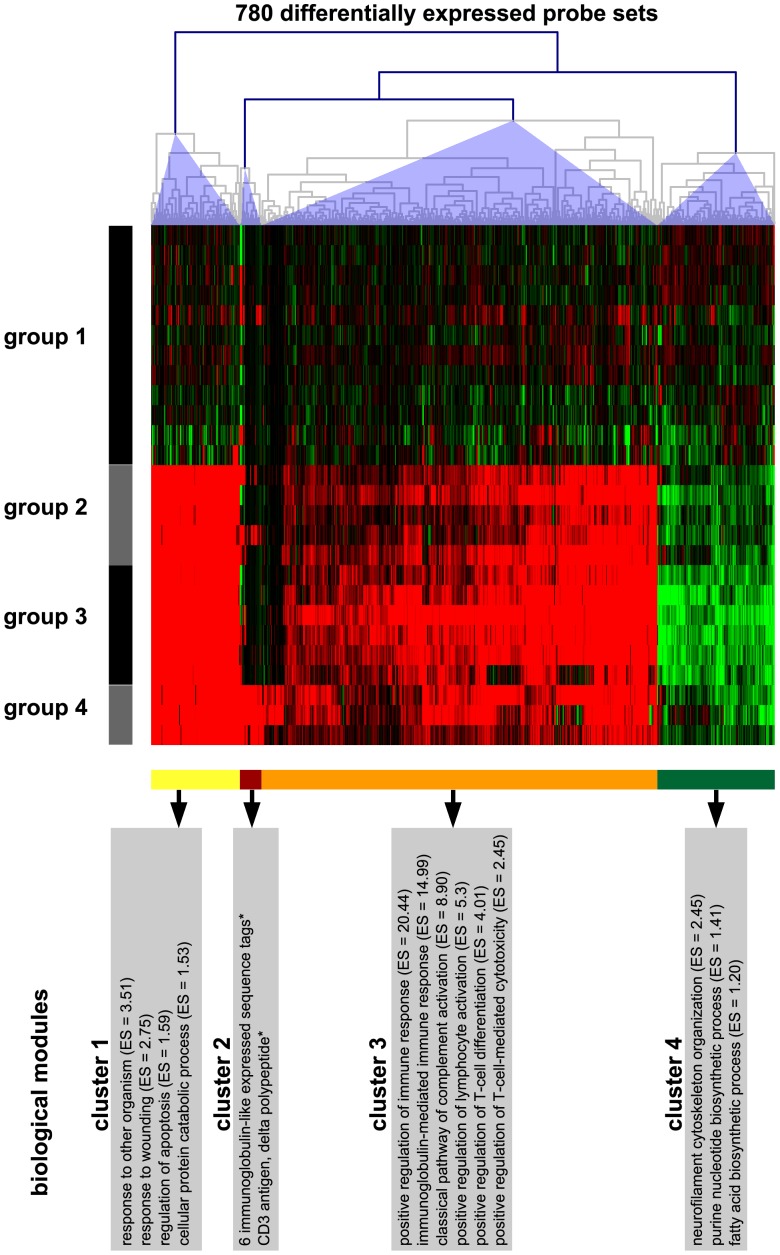
Figure 2. Heatmap displaying the expression profile of the 780 DEPs.
Hierarchical cluster analysis of the 780 DEPs was performed employing Euclidean distance and complete linkage to reveal similar expression patterns. Each column represents one of the 780 DEPs and each row one of the 26 biological replicates (cerebellar specimens of individual dogs) sorted according to the histologically defined subtypes of CDV leukoencephalitis: group 1 = controls; group 2 = acute CDV leukoencephalitis; group 3 = subacute CDV leukoencephalitis; group 4 = chronic CDV leukoencephalitis. The heatmap displays the log2-transformed individual fold changes relative to the mean expression of the controls indicated by a color scale ranging from –2 (4-fold down-regulation) in green to 2 (4-fold up-regulation) in red. Accordingly, the DEPs are subdivided into four clusters with distinct expression profiles (yellow, brown, orange and green bars below the heatmap). Gene ontology analysis of the orthologous mouse genes followed by functional annotation clustering revealed distinct biological modules within the DEPs of cluster 1, 3, and 4. * = important associated genes and expressed sequence tags are reported for the DEPs of cluster 2 since automated gene ontology analysis revealed no significant results due to poor annotation quality. ES = enrichment score.

