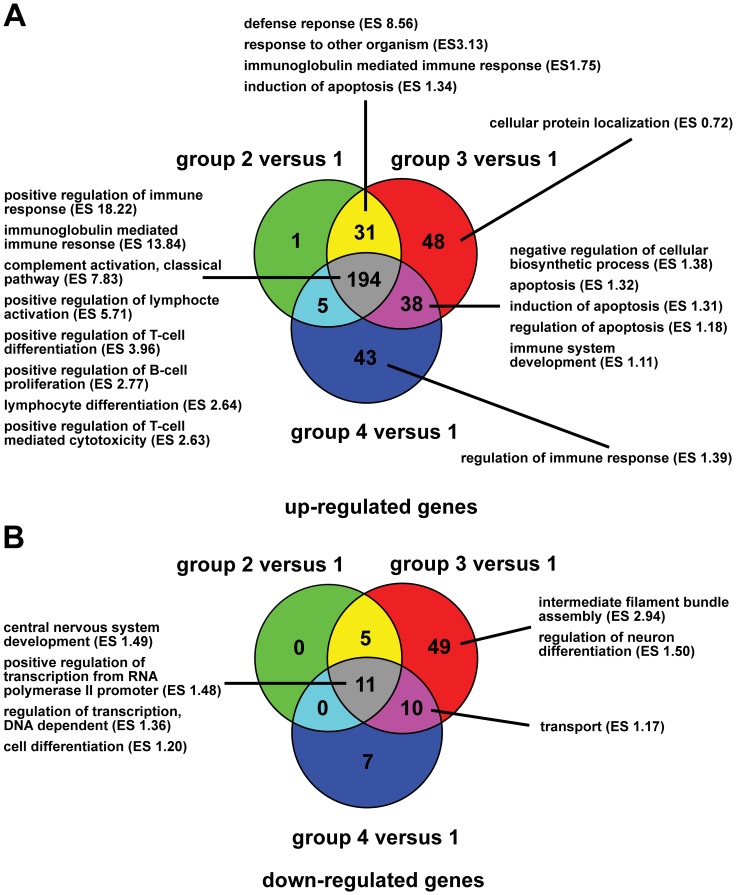
Figure 3. Venn diagrams comparing the DEGs within the a priori defined subtypes of CDV leukoencephalitis.
The three subtypes of CDV leukoencephalitis (group 2–4) are compared for shared and unique DEGs as well as associated biological modules as detected by gene ontology analysis and functional annotation clustering of the orthologous mouse genes. (A) The Venn diagram displays the numbers and intersections of the up-regulated DEGs in the three subtypes of CDV leukoencephalitis (group 2–4) as compared to controls (group 1), respectively. (B) The Venn diagram displays the numbers and intersections of the down-regulated DEGs in the three subtypes of CDV leukoencephalitis (group 2–4) as compared to controls (group 1), respectively. ES = enrichment score; group 1 = controls; group 2 = acute CDV leukoencephalitis; group 3 = subacute CDV leukoencephalitis; group 4 = chronic CDV leukoencephalitis.

