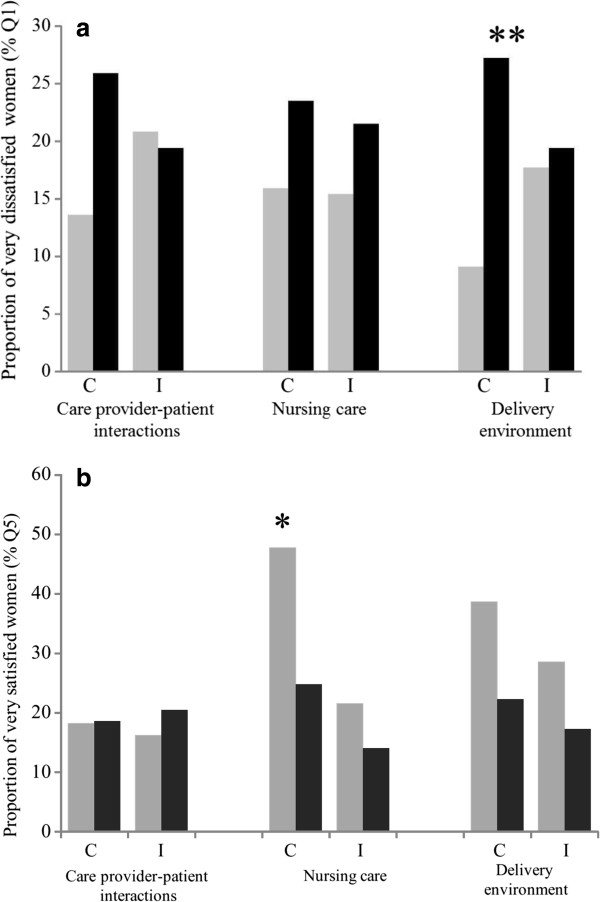
Figure 1.
Frequency of very dissatisfied and satisfied women among the poorest and the wealthiest ones, for each group (control/intervention) and each dimension. a. Most dissatisfied women and wealth. Frequency of very dissatisfied women (lowest quintile of satisfaction Q1) in the poorest and wealthiest wealth quintile for each group (control/intervention) and each dimension. b. Most satisfied women and wealth. Frequency of very satisfied women (highest quintile of satisfaction Q5) in the poorest and wealthiest wealth quintile for each group (control/intervention) and each dimension. Footnote. Histograms in grey and black corresponded to the poorest wealth quintile and wealthiest wealth quintile, respectively. Abbreviations: C, control health district of Djibo (with fees); I, Intervention health district of Sebba and Dori (without fees). Significance level on comparison of *p < 0.05, **p < 0.01.

