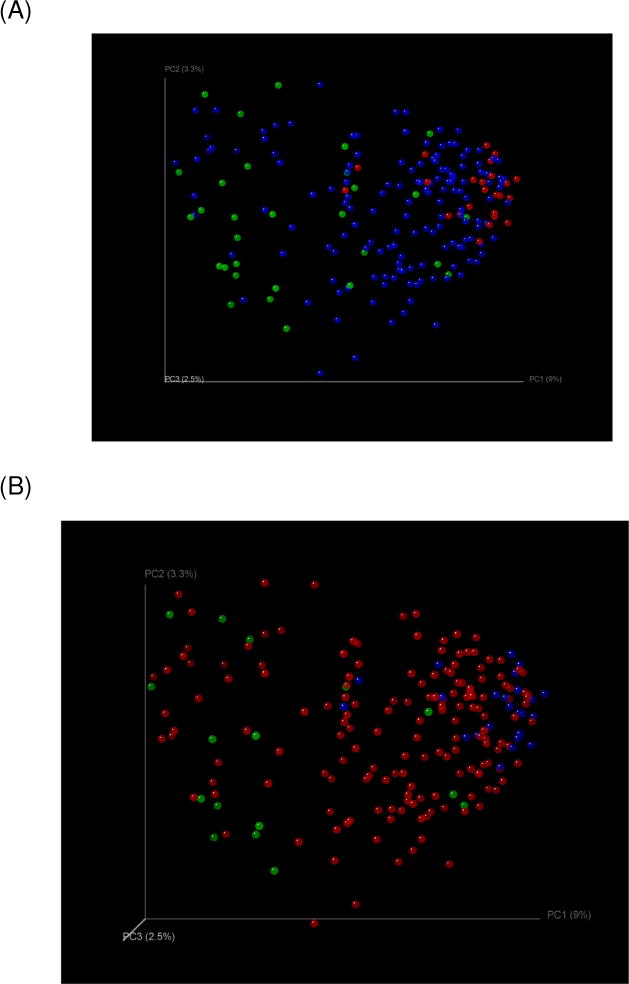
Fig. 3. PCO analysis of microbiota in patients with poor outcomes within 30 days.

Fig. 3(A): Organ failure: Clustering of controls (red) with cirrhotics without (blue) and away from those with organ failure (green)
Fig. 3(B): Death: Clustering of controls (blue) with cirrhotics without outcomes (red) and away from those who died (green)
