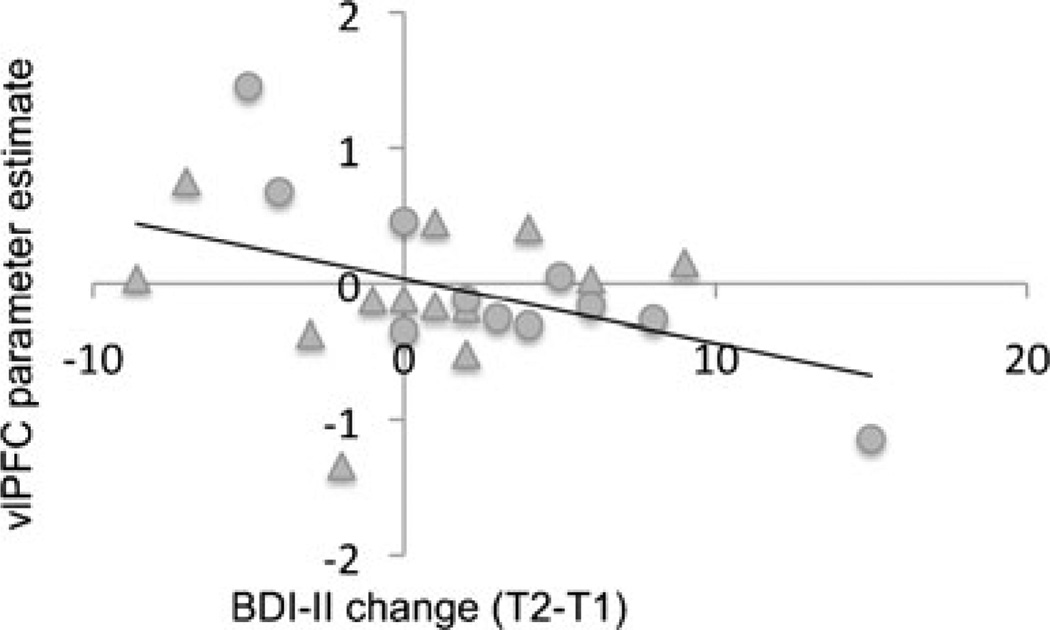
Fig. 2.
Scatterplot showing the inverse relation between activation in the left ventrolateral prefrontal cortex (vlPFC) at Time 1 and subsequent change in depressive symptoms. All values are unadjusted. Circles indicate never-depressed participants, and triangles represent remitted depressed participants. T1 = Time 1; T2 = Time 2; BDI-II = Beck Depression Inventory–II. Parameter estimates represent single-subject activation values, extracted from the vlPFC cluster identified using the contrast of Positive Recall 2 versus Mood Elaboration

