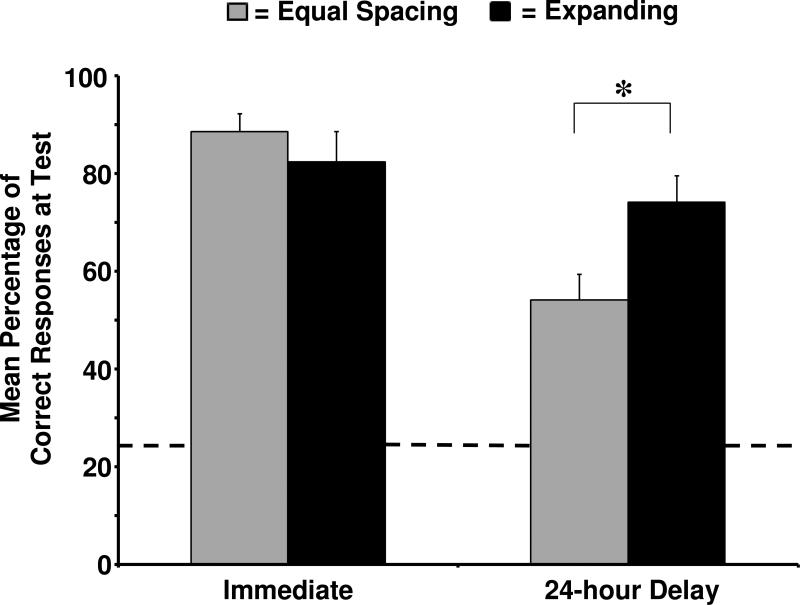
Figure 2.
Mean percentage of correct responses by presentation timing condition (equal spacing or expanding) and testing delay (immediate or 24-hour delay). Error bars represent one standard error. The dashed line represents chance performance; children in all conditions performed significantly above chance performance. A * represents a significant difference, p < .05.

