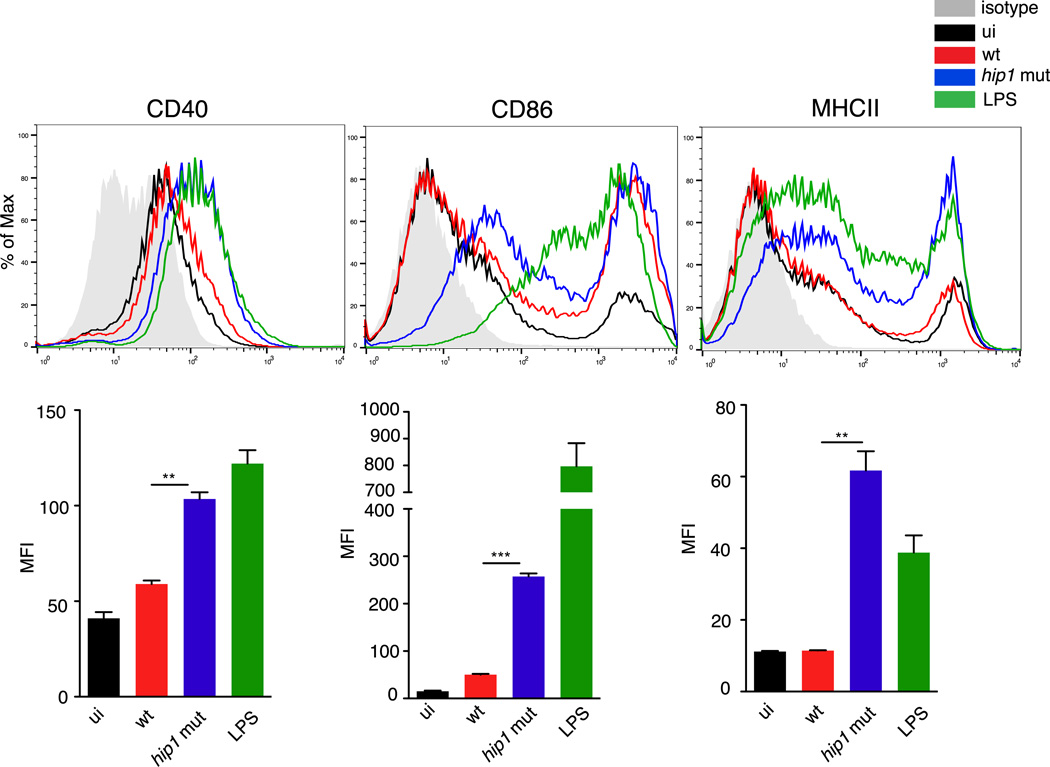
FIGURE 2.
Enhanced surface expression of CD40, CD86 and MHC class II on hip1 mutant-infected DCs. C57BL/6J BMDCs were exposed to medium alone (ui), heat-killed wild type (wt) or hip1 mutant at MOI=5 or 1 µg/ml LPS for 24 hours. DCs were labeled with anti-CD11c-APC and anti-CD40-PE, anti-CD86-PE or anti-MHC class II-PE. Representative histograms and median PE fluorescence intensity for CD11c+ cells are shown. Isotype control is shown as gray shaded area. Data are representative of three independent experiments. Values are presented as mean +/− SD, **, p<0.01; ***, p<0.001.

