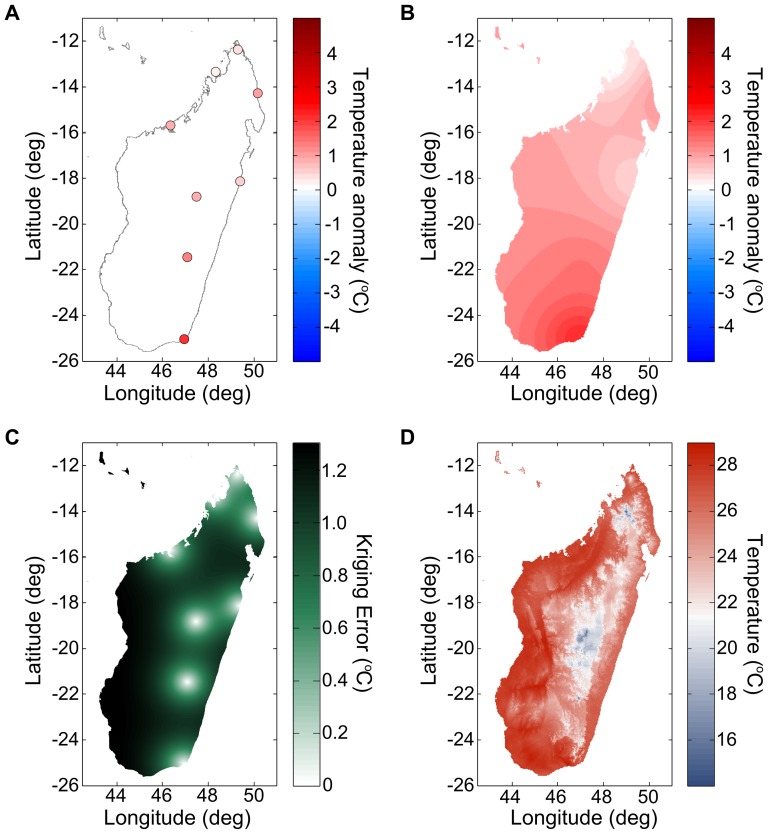
Figure 1. Kriging air temperature from Madagascar weather stations.
(A) Extracted air temperature anomalies on January 1st, 2010. The periodic seasonal components are removed using Fourier transforms. (B) Kriged anomalies across the island and the resulting error estimate (C). The Kriging error increases away from reporting weather stations at the half-correlation distance speed up to the square root of the sill. (D) Combining the WorldClim-derived average temperature surface for that day and the Kriged temperature anomaly, we obtain a prediction of the air temperature throughout the island. In this last image and throughout the data set, the systematical effects of altitude dominate the day-to-day variations due to weather.

