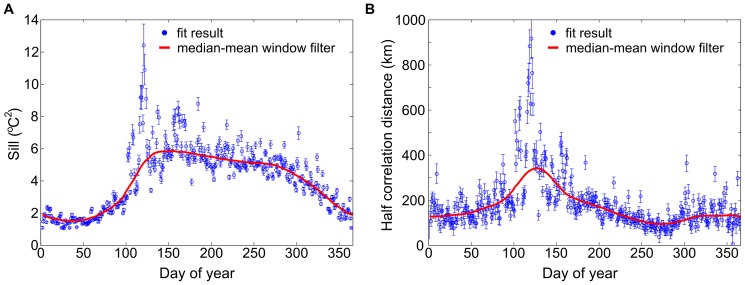
Figure 7. Variogram parameters.
Dew point variogram parameters for Madagascar, from 1981–2010, by day-of-year: sill (A) and half correlation distance (B). The blue circles result from fitting the variogram for each day-of-year; the red curve is the smooth output of the median-mean window filter described in the Methods section and used in our Kriging algorithm.

