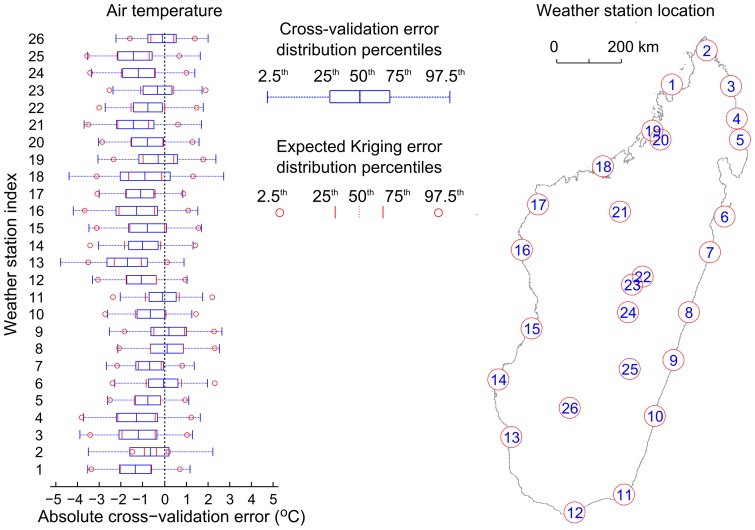
Figure 10. Cross-validation of air temperature Kriging estimates across Madagascar.
(Left) For each weather station, the observed absolute error distribution (blue) is compared with the median error distribution predicted by the Kriging interpolation method (red). The percentiles corresponding to the different features of the boxplot are explained in the legend. (Right) Index of weather station location in Madagascar.

