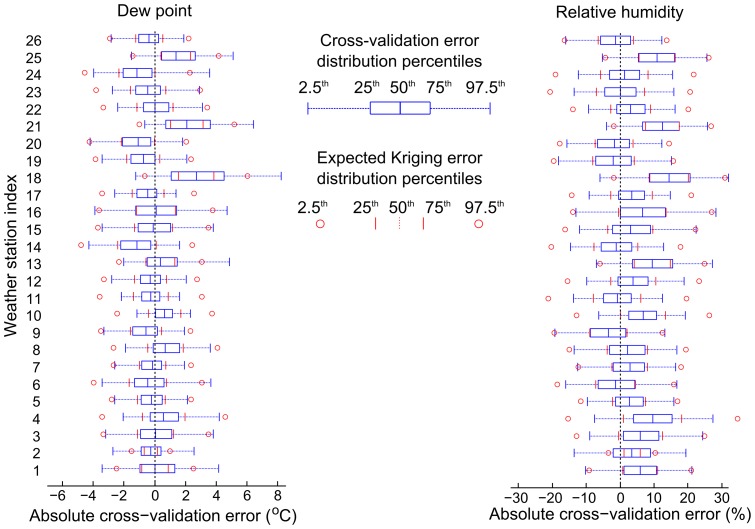
Figure 11. Cross-validation for relative humidity Kriging estimates across Madagascar.
(Left) cross-validation error distributions for dew point, and (right) cross-validation errors for relative humidity. The percentiles corresponding to the different features of the boxplot are explained in the legend.

