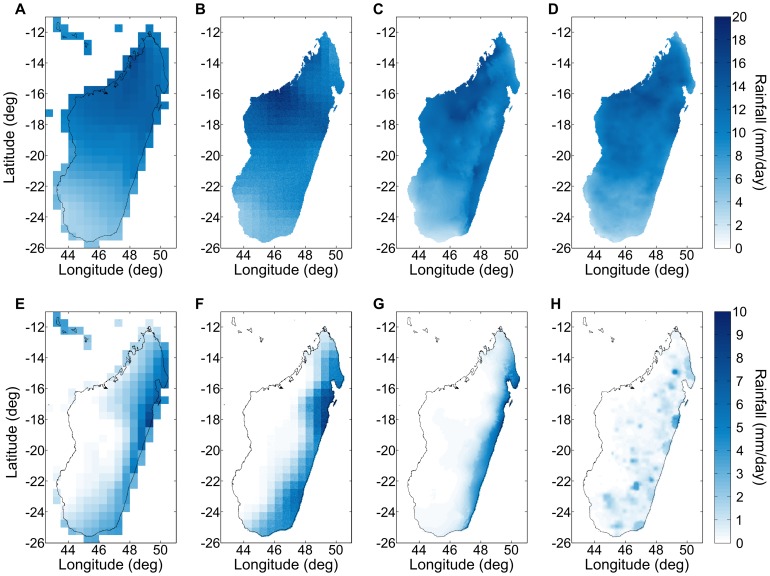
Figure 14. A comparison of rainfall climate layers.
Average January rainfall across Madagascar according to (A) the CRU2.1 CL (1991–2000) data set [88], (B) the GPCC (1995–2004) data set [89], and (C) the WorldClim (1950–2000) data set [64] compared to (D) the average rainfall from the RFE 2.0 (2001–2010) data set [58]. Average July rainfall according to (E) the CRU2.1 CL (1991–2000) data set [88], (F) the GPCC (1995–2004) data set, and (G) the WorldClim (1950–2000) data set compared to (H) the average rainfall from the RFE 2.0 (2001–2010) data set. There is good agreement between the RFE 2.0 derived climate layer and other established climate layers during the rainy season (e.g., January), but during the dry season (e.g., July) all four climate layers differ, the RFE 2.0 most significantly.

