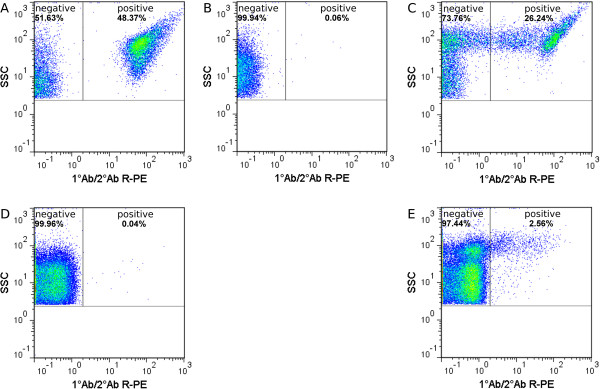
Figure 5.

Immunofluorescence testing by flow cytometry. 5 μg/mL 1°Ab and 20 μg/mL R-PE conjugated 2°Ab were used representative pseudo color dot plots for (A)B. cepacia, (B)P. aeruginosa and (C)S. aureus in exponential growth phase (t = 2 h) from pure cultures. Additionally for species with positive immunofluorescence signal using 1°Ab and 2°Ab, binding of 2°Ab alone was tested: (D)B. cepacia and (E)S. aureus. Gates were set manually based on R-PE fluorescence signal of unstained and stained cells. For each gate, relative frequencies of total events are presented.
