Figure 7.

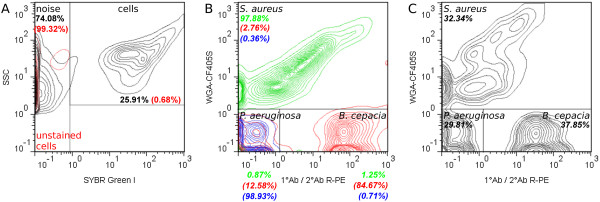
Species discrimination in flow cytometric viability analysis. Four-color staining was applied. Samples were incubated with 20 μg/mL WGA-CF405S, 10 μg/mL 1°Ab and 60 μg/mL R-PE conjugated 2°Ab, SYBR Green I (dilution of 5 × 10³) and 5 μg/mL PI. (A) For data analysis, only events with SYBR Green I positive fluorescence (cells) were considered. The cell gate was set manually based on the signal of four-color-stained (black) and unstained cells (red) in exponential growth phase (t = 4 h) from pure culture. (B, C) Gating for species discrimination in data acquired from mixed culture samples. Gate was set manually based on WGA-CF405S fluorescence and R-PE immunofluorescence signals of four-color-stained single species from pure culture. (B) Overlaid cytometric plot of P. aeruginosa (blue), B. cepacia (red) and S. aureus (green) in exponential growth phase (t = 4 h) from pure culture. (C) Gate applied for species discrimination in mixed culture sample at time point of inoculation. For each gate region, either relative frequencies of total events or cells (in italics) are shown. Data is presented in 5% quantile contour plots.
