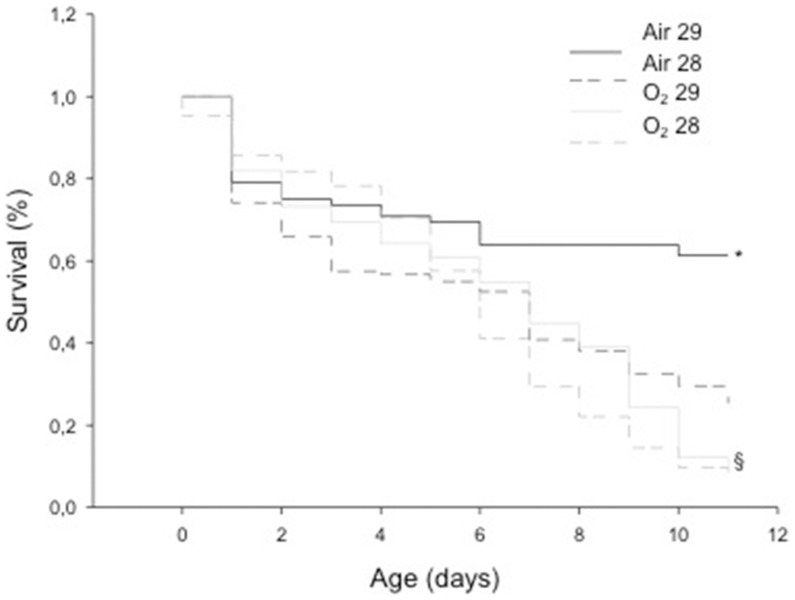
Figure 1. Kaplan-Meier survival curves – A comparison between the groups ‘room air’ and ‘oxygen’ is shown with animals born at 28 (dashed lines) and 29 days of gestation (solid lines).
A higher survival rate was observed in both Air Groups (*, p<0.05 vs Oxygen Groups) and a higher survival rate among O2 29 animals vs O2 28 Group (§, p<0.05)

