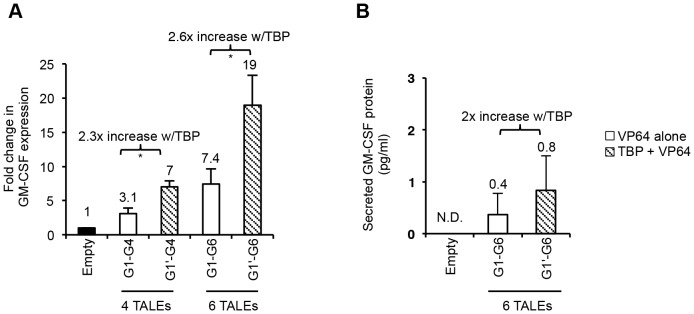
Figure 6. TBP-mediated enhancement of GM-CSF activation.

(A) Quantitative RT-PCR analysis of GM-CSF gene expression in 293FT cells. 293FT cells were transfected with either empty vector control alone, G1-VP64 (white bars, G1) or G1-TBP (shaded bars, G1’) in combination with indicated GM-CSF specific VP64-TALE activators. Results are shown as fold change in GM-CSF gene expression relative to empty vector control. (B) GM-CSF ELISA analysis of TALE activity in 293FT cells. Results shown are the amount of secreted GM-CSF protein in a 30-fold concentrated sample normalized to empty vector control by background subtraction. ND indicates ‘not detected’. Results shown are of three independent experiments (error bars, mean +/−SD, n = 3). Statistical analysis determined using one-tailed, paired t-test (P<0.05*).
