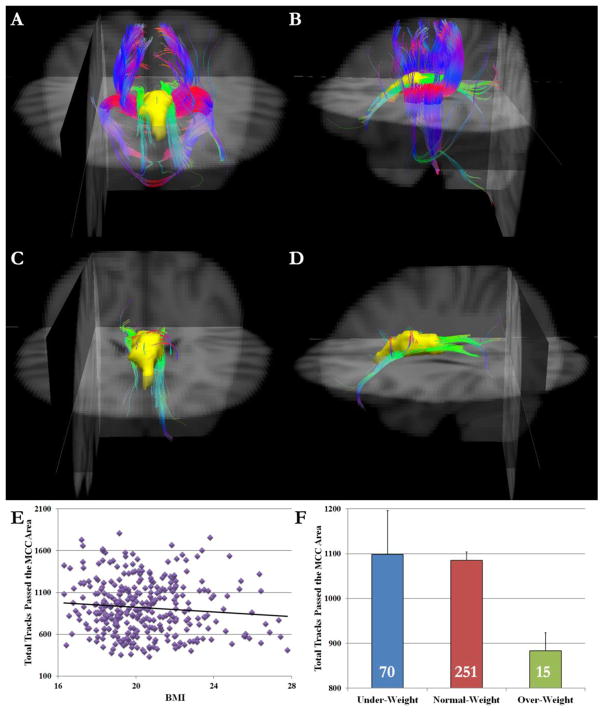
Fig. 3.
Anterior (A) and left lateral view (B) of a sample participant who had many tracks passing the MCC region. In contrast, (C) and (D) show a sample participant who had few tracks passing the MCC region. The MCC ROI is shown in yellow. Red indicates the medio-lateral plane, green the dorso-ventral orientation, and blue the rostro-caudal direction. Background images are in radiological orientation. (E) Scatter plot shows the negative correlation pattern between BMI and total tracks that passed the MCC region. (F) The overweight group showed fewer tracks passing the MCC region than both under-weight and normal-weight groups. The number on each bar denotes the number of subjects in each group. Error bars indicate standard errors.

