
Figure 4. Demonstrating high specificity and scalability of 96-plex PEA.
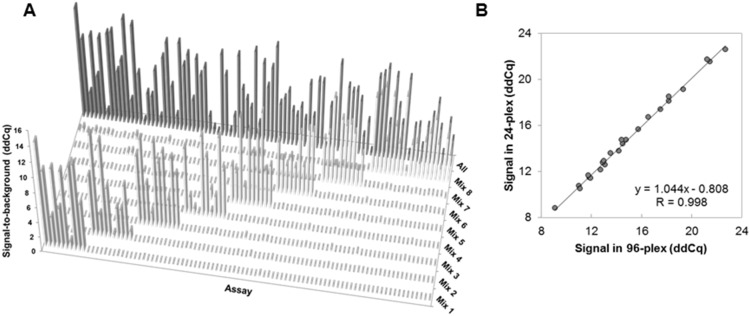
(A) Submixes of antigens were analyzed and demonstrated that the different assays only responded to the submix containing the corresponding antigen and at signal-to-noise levels similar to that of the mix containing all antigens. (B) Scalability was assessed by analyzing 24 PEA assays either in 24-plex or 96-plex, and the normalized levels plotted and compared in an xy scatter. This demonstrated a Pearson correlation value (R) as high as 0.998.