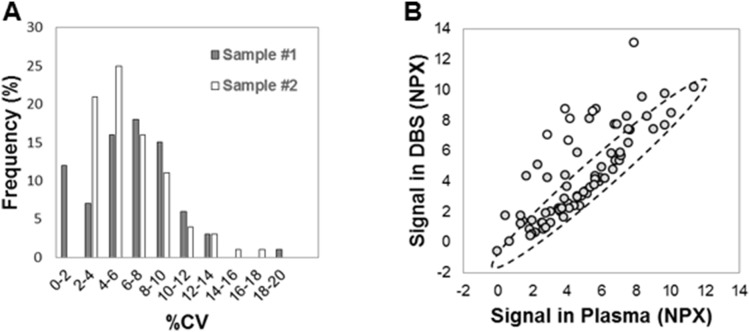
Figure 7. Applying multiplex PEA to the analysis of dried blood spots (DBS).
DBS samples were analyzed by 96-plex PEA. (A) Inter-spot precision was assessed in duplicate samples. Shown is the distribution of %CV across all assays for two individuals (gray and white). (B) EDTA DBS and EDTA plasma samples from the same individual were analyzed. The normalized protein expression es (NPX) is shown as an XY scatter plot demonstrating a Pearson correlation value (R) of 0.75 between the two sample types (gray series).

