Figure 6.
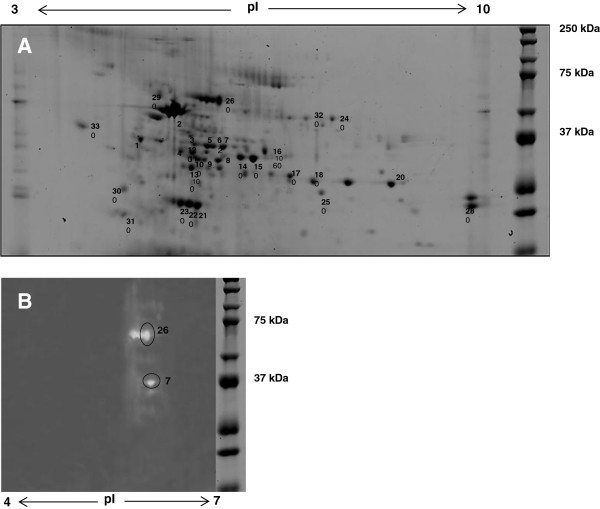
Two-dimensional gel electropherogram and its amylase zymogram. (A) 2D gel was scanned with a Typhoon FLA 9000 laser scanner (GE Healthcare) using a no emissions filter, PMT 600, Laser Red (633) and normal sensitivity. Crude extracellular proteins (approx. 200 μg) from the supernatant of P. minima following growth in the first hydrolase-inducing medium for 7 days were used to perform 2D gel electrophoresis. Proteins were visualized on a 12% SDS-PAGE gel stained with Coomassie Blue and identified by LC-ESI-MS/MS as indicated in Table 3. (B) Amylase zymogram (pI 4 to 7) produced after 2D gel electrophoresis of protein using crude sample. No amylase activity was detected above around pI 6. Protein in spots 26 and 7 could be assigned to α-amylase in the NCBI nr database by LC-MS/MS analysis (Table 3). Two spots beside spot 26 could be isomers of amylase with different pI.

