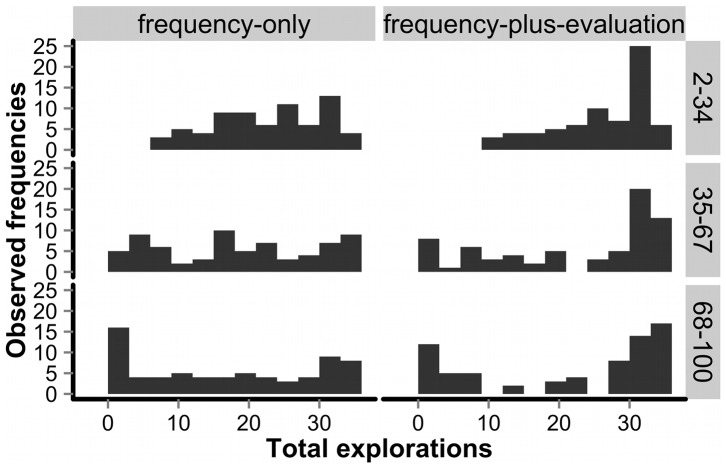
Figure 3. Temporal changes in frequency distributions of exploratory choices in the group condition.
Shown from top to bottom, the first block (rounds 2–34), the second block (rounds 35–67) and the last block (rounds 68–100). The y-axis refers to observed frequencies of participants with a given exploratory-choice frequency in each sub-condition (both N = 70).

