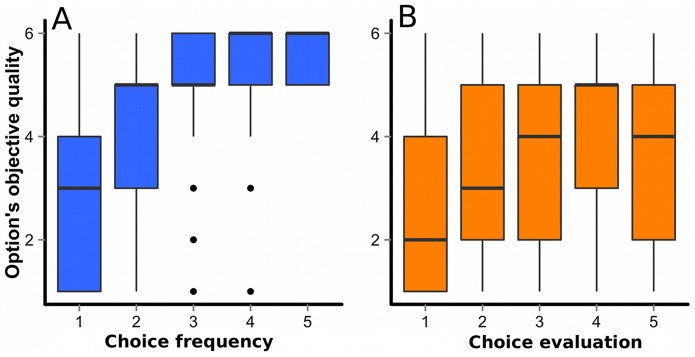
Figure 6. Validity of frequency and evaluation information in the frequency-plus-evaluation sub-condition.
A: Relation between option quality and choice frequency. The y-axis refers to the mean objective quality of options chosen by 1, 2, 3, 4, or 5 participants in each round. B: Relation between option quality and choice evaluations. The y-axis refers to mean objective qualities of options rated on the 5-point scale ranging from 1 (very bad) to 5 (very good). We merged all rounds of all 14 groups into one dataset, thus both graphs represent 5000 observations each. The horizontal bars represent medians, while the boxes represent 50% ranges, and the vertical bars represent 1.5 * IQR (the inter-quartile range).

