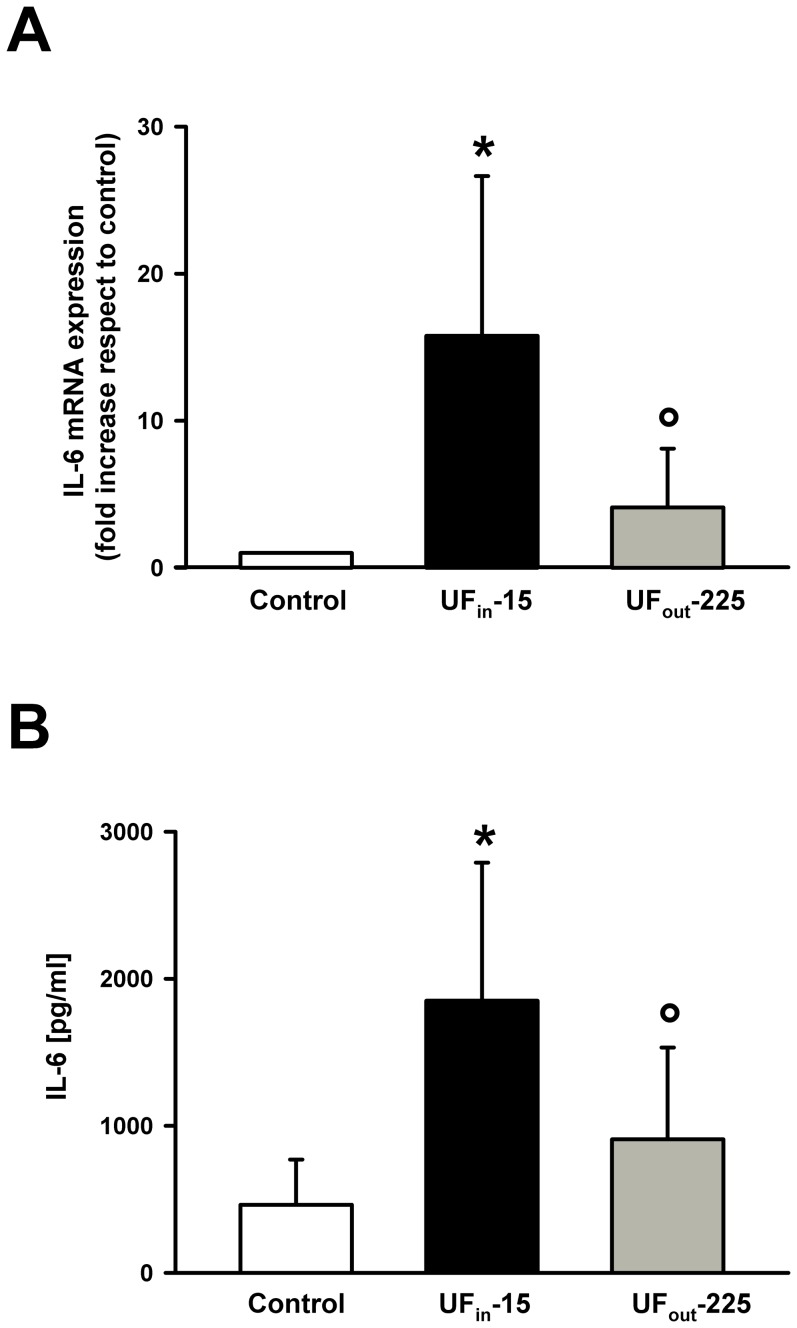
Figure 2. Effect of UFin-15 and UFout-225 on IL-6 gene expression and on IL-6 release in PBMC cultures from healthy subjects.
A Mean ± SD of the fold increase in IL-6 gene expression respect to controls observed in PBMC cultures from 12 healthy volunteers, exposed to UFin-15 (black) and UFout-225 (dark gray). Data were normalized to β-actin mRNA expression and expressed as percent increase respect to those obtained in control cultures, set at 1, in which no UF was added. B, Mean ± SD of immunoreactive IL-6 concentrations in culture media of PBMCs from twelve healthy volunteers after a 24 h incubation with saline (basal condition, white), UFin-15 (black), or and UFout-225 (dark gray). *p<0.05vs control; °p<0.05 vscontrol and UFin-15, at Kruskal-Wallis one way analysis of variance on ranks followed by Student-Newman-Keuls post hoc test.

