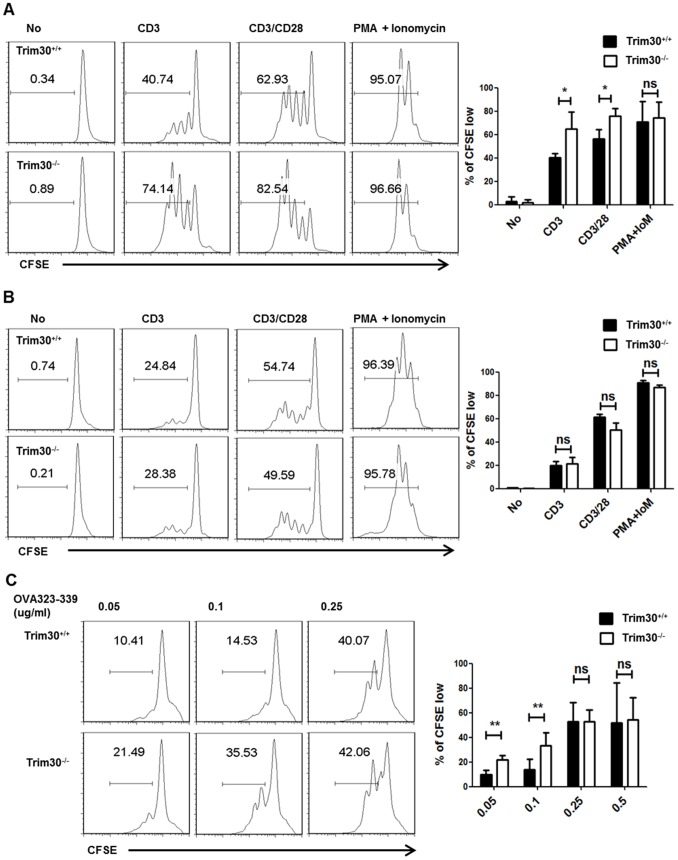
Figure 3. Enhanced proliferation of Trim30 −/− CD4 T cells.
(A) Purified CD4+ T cells from Trim30 +/+ and Trim30 −/− spleens were labeled with CFSE and cultured with the indicated supplements (No, medium; CD3, 2 µg/ml of plate-coated anti-CD3 antibody; CD3/CD28, 2 µg/ml of plate-coated anti-CD3 antibody and soluble anti-CD28 antibody; PMA+Ionomycin, 10 ng/ml of PMA and 500 ng/ml of ionomycin) for 3 days. The CFSE intensity of the CD4+ T cells was measured with flow cytometry, and representative plots for Trim30 +/+ and Trim30−/− T cells are shown with the percentages of the dividing cells given as those with diluted levels of CFSE staining. (B) Purified CD8+ T cells from Trim30 +/+ or Trim30 −/− mouse spleens were analyzed as described above for (A). (C) Splenocytes from Trim30 +/+and Trim30 −/−OT-II mice were activated with the indicated concentration of Ova 323–339 peptide for 3 days. Proliferation of T cells was measure by CFSE intensity after gating for CD4+ cells. The results of four independent measurements are shown on the right. The P-value was calculated using the t–test. *; P<0.05; **, P<0.005, ns; not significant. Error bars represent s.d.

