
Figure 1. Schematic overview of the amplification, sequencing and analysis workflow.
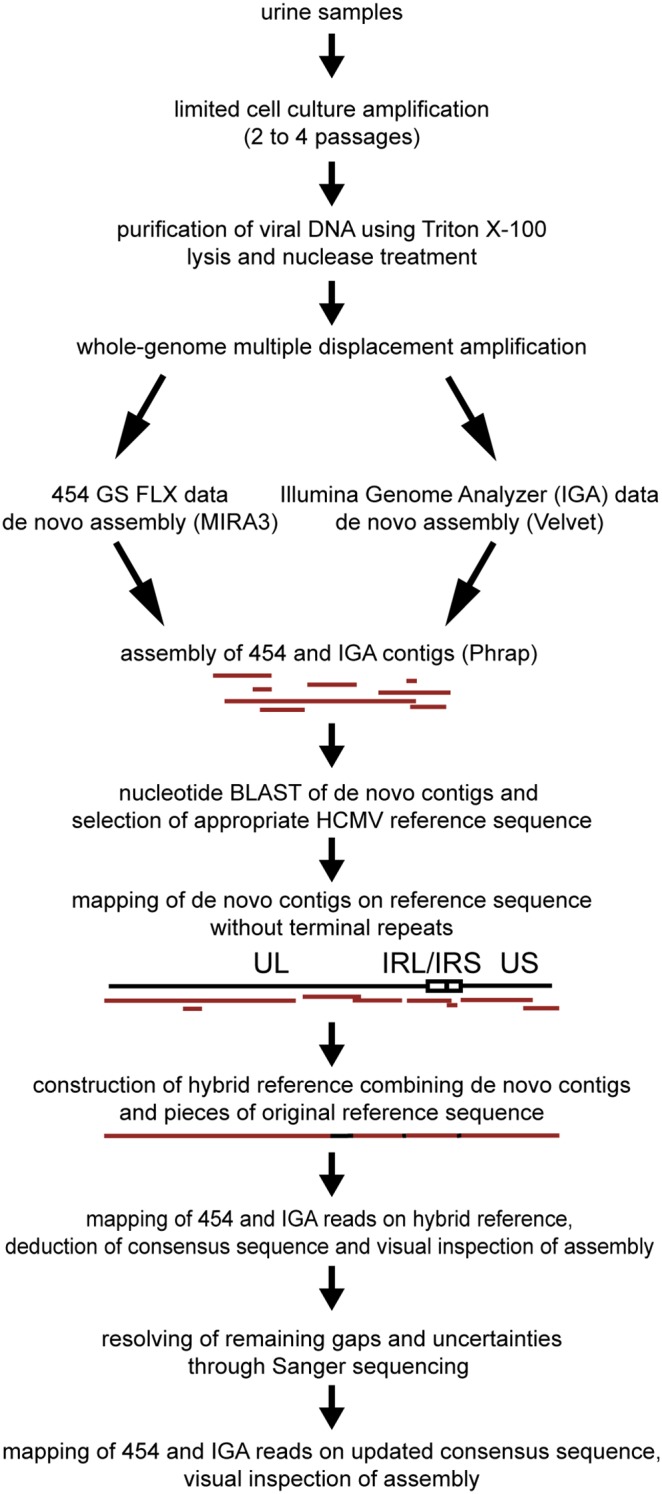
UL and US denote unique and unique short regions of the genome; IRL and IRS denote internal repeats.
Official websites use .gov
A
.gov website belongs to an official
government organization in the United States.
Secure .gov websites use HTTPS
A lock (
) or https:// means you've safely
connected to the .gov website. Share sensitive
information only on official, secure websites.
UL and US denote unique and unique short regions of the genome; IRL and IRS denote internal repeats.