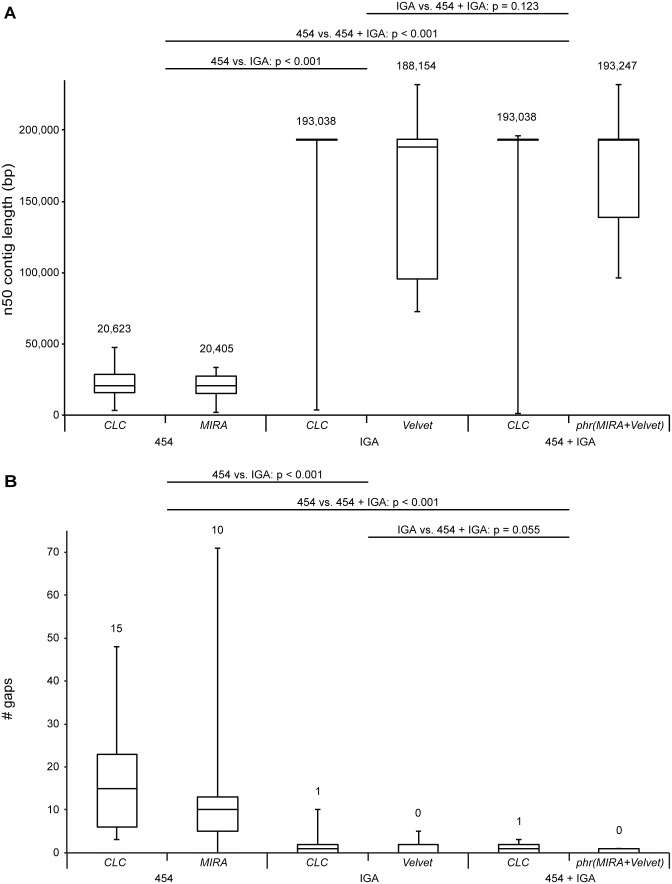
Figure 3. Assembly performance using 454 GS FLX, IGA or both and freeware or commercial software suites.
Boxplots representing [A] the range of n50 contig lengths and [B] number of gaps in contig coverage of consensus sequences after de novo assembly of respectively 454 GS FLX, IGA or combined datasets. The central line in the box represents the median, top and bottom represent the 75 and 25 percentile and error bars represent minimum and maximum values. Median values are stated above each boxplot. Datasets (454 GS FLX and/or IGA) and software suites (CLC Genomics Workbench, MIRA, Velvet or Phrap combining MIRA and Velvet assemblies) are indicated below the plots. Since normality was violated, overall differences for n50 contig length and number of gaps were tested with the non-parametric Friedman test (n = 13; n50 contig length: χ2(5) = 42.506, p<0.001; gaps: χ2(5) = 37.275, p<0.001). Comparisons between assemblies based on different datasets were made using the Wilcoxon Signed Ranks Test with Bonferroni correction; p-values are reported in the figure. Because of the Bonferroni correction, differences are only significant when p<0.017.

