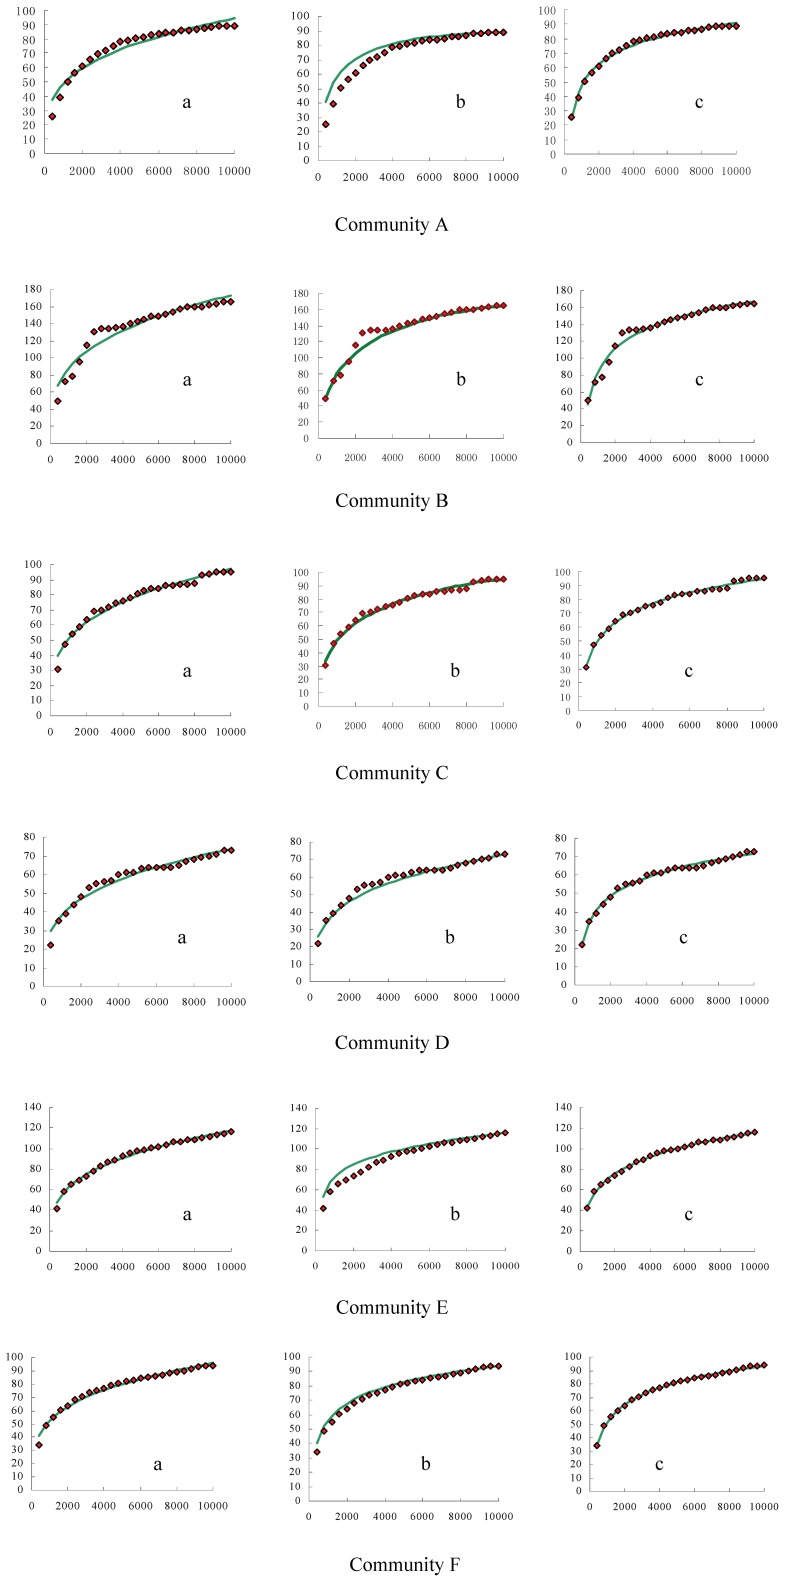
Figure 1. Species-area relationships in six subtropical forest communities (see Table 1), shown in successive rows (observed number of species: red diamonds; fitted model curves: green line).
The left column (a) is simulated using the power model, the middle column (b) using the random-placement model, and the right column (c) using the logarithm model (for parameter values, see Tables 2 and 3). The x-axis represents the area (m2), and the y-axis represents the number of species.

