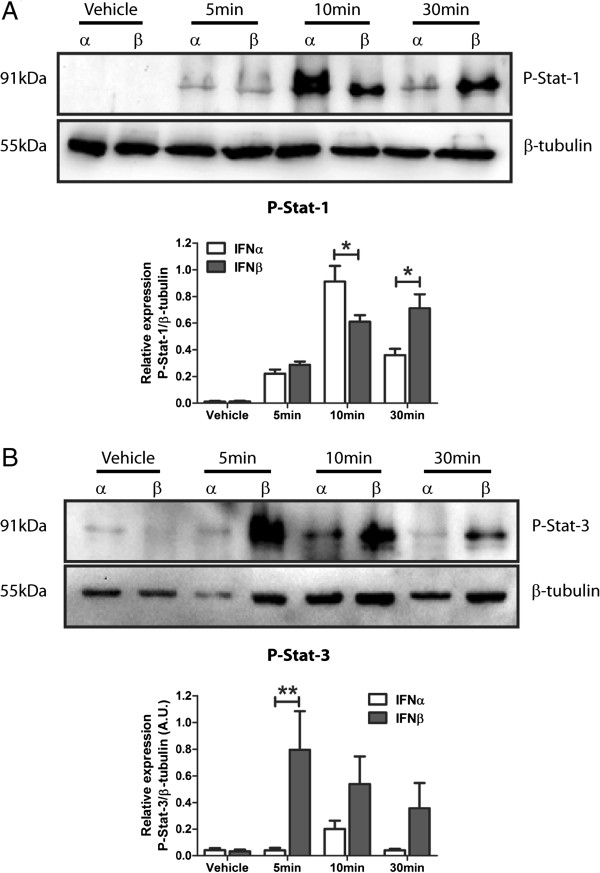
Figure 1.
Type-1 interferon α and β induce differential phosphorylation of Stat isoforms. (A) Representative western blot of IFNα/β (1,000 U/mL) treated M17 cells probed for P-Stat-1 and corresponding densitometry (*P <0.05, n = 3, unmatched two-way ANOVA, Bonferroni post-hoc test). (B) Representative western blot of IFNα/β (1,000 U/mL) treated M17 cells probed for P-Stat-3 and corresponding densitometry (**P <0.01, n = 3, unmatched two-way ANOVA, Bonferroni post-hoc test). For densitometry calculations, phosphorylation intensity was measured in arbitrary units (A.U.) and normalised to the β-tubulin loading control. Graphical data are represented as mean ± SEM.

