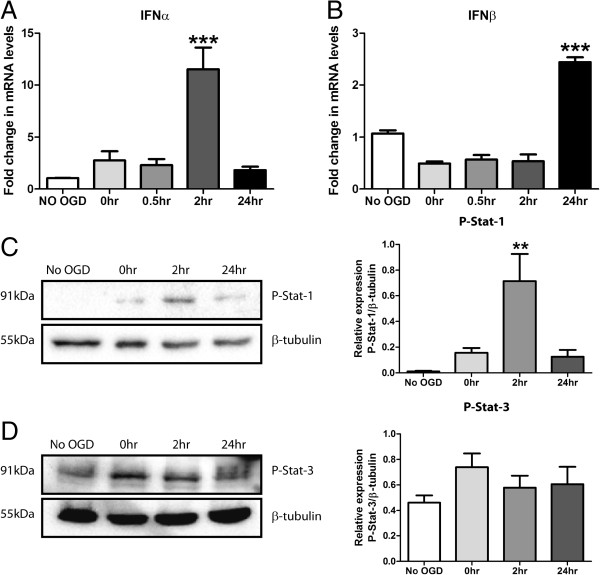
Figure 3.
Type-1 IFN production and signalling plays a role in the cellular response to OGD insult. M17 cells were subjected to 4.5 h of OGD and reperfused for a 0 to 24 h period. Q-PCR was then performed detecting: (A) IFNα and (B) IFNβ mRNA levels (***P <0.001, n = 3, unmatched one-way ANOVA, Dunnett’s post-hoc test). Western blot analysis was performed on total cell extracts probing for (C) P-Stat-1 and (D) P-Stat-3 and corresponding densitometry is shown (**P <0.01, n = 4, unmatched one-way ANOVA, Dunnett’s post-hoc test). For densitometry calculations, phosphorylation intensity was measured in arbitrary units (A.U.) and normalised to the β-tubulin loading control. Graphical data are represented as mean ± SEM.

