
Figure 3. BOLD activation by condition in right inferior occipital gyrus.
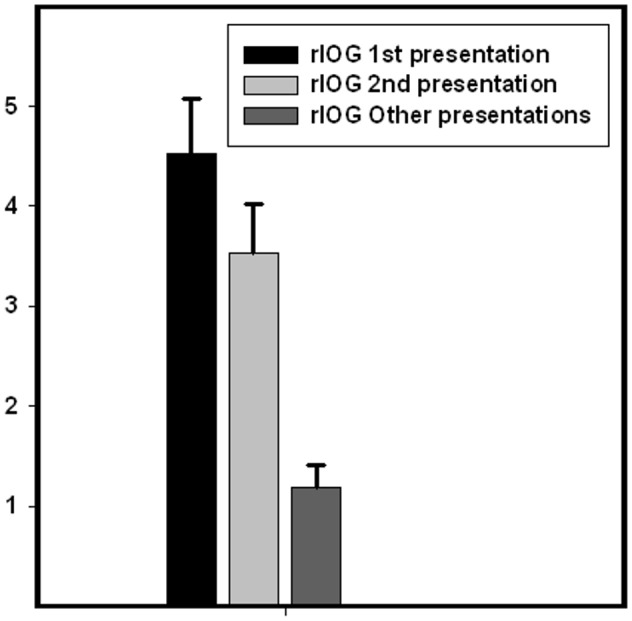
Beta values for the peak voxel in right inferior occipital gyrus (x = 34, y = −78, z = −12) for the conditions 1st presentation, 2nd presentation and other presentations of the emotional faces. The figure illustrates that the right inferior occipital gyrus BOLD fMRI response was significantly reduced in the 2nd compared to the 1st presentation. However, the BOLD response during the 2nd presentation was significantly greater than the mean response from the remaining presentations of the faces.