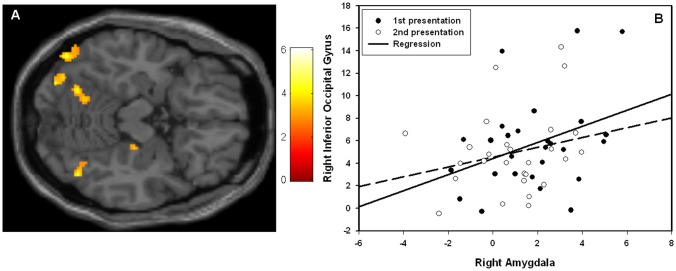
Figure 4. Psychophysiological interaction analysis.
The results of the psychophysiological interaction analysis. (A) Statistical parametric map (SPM) showing regions in the visual cortex that showed condition-specific BOLD signal changes with right amygdala activity. The image is thresholded at p<0.005, 25 voxels extent threshold, for illustrative reasons. The colors refer to t-values as coded in the bar to the right of the image (B) Scatter plot with regression lines demonstrating the pattern of functional connectivity. The x-axis represents activity in the right amygdala (beta values) peak voxel and the y-axis represents activity in the right inferior occipital gyrus peak voxel (beta values).

