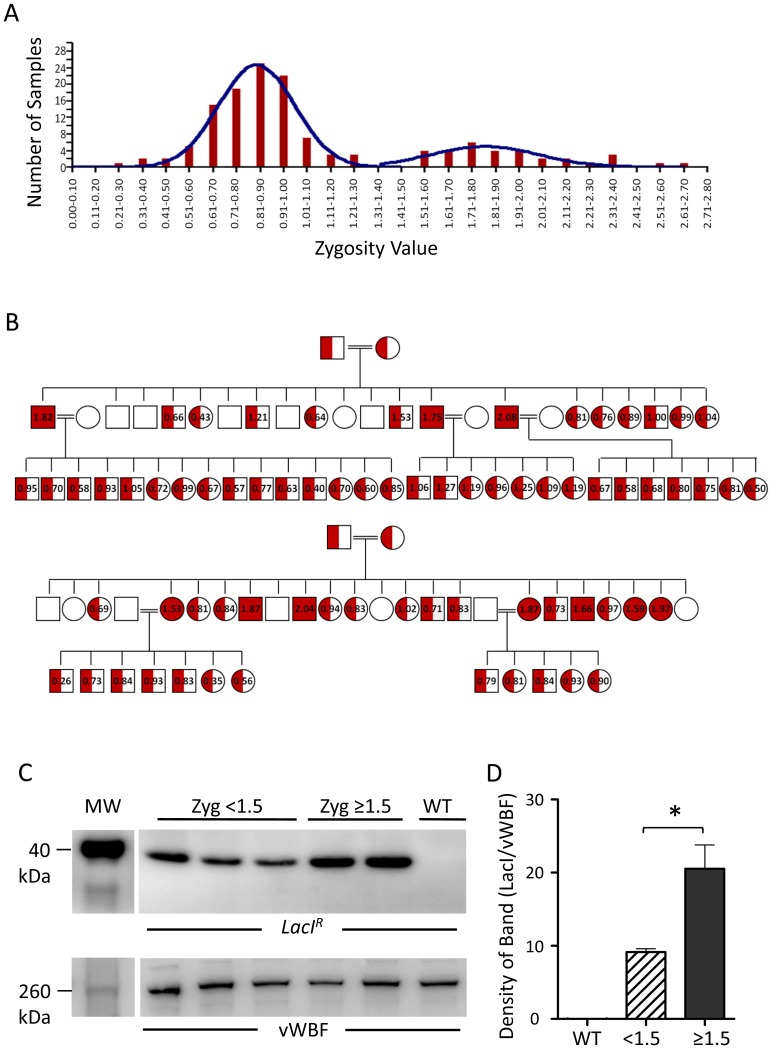
Figure 3. Detection of LacIR homozygosity using quantitative PCR.
(A) Binning of zygosity values from heterozygous matings demonstrates two populations indicative of heterozygotes and homozygotes. (B) Interbreeding of predicted heterozygotes produces wildtype, heterozygote and homozygote populations in Mendelian ratios. (C) LacIR expression in predicted homozygotes (zygosity ≥1.5) is greater than in predicted heterozygotes (zygosity <1.5). Representative blots and group data for 3 heterozygote and 5 homozygote samples. WT wildtype. *P<0.05 denotes significant difference.

