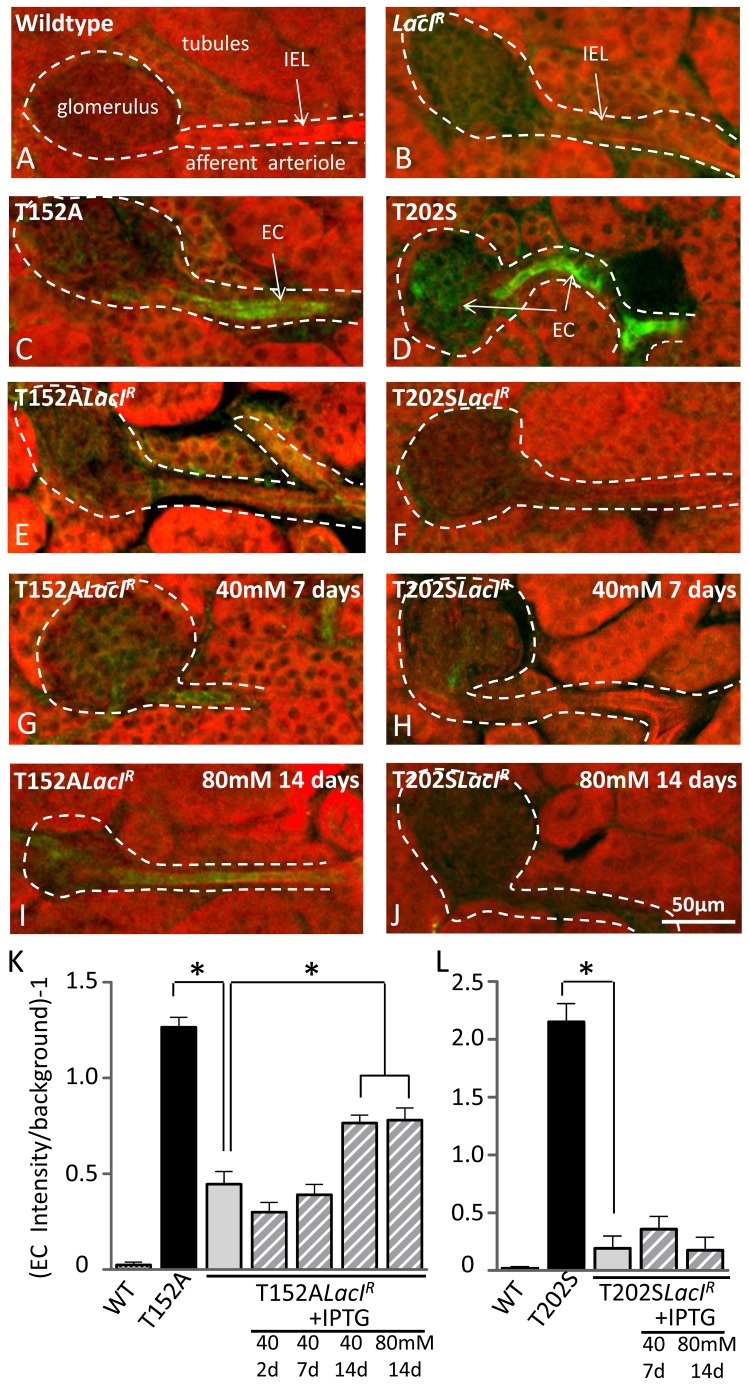
Figure 5. Control of EGFP expression by LacIR and IPTG: Immunohistochemistry.
Immunohistochemical staining for EGFP demonstrates endothelial (EC) staining in T152A (C) and T202S transgenic mice (D) but not in wildtype (A) or LacIR (B) mice. Interbreeding of transgenic mice with LacIR mice led to a significant reduction in EGFP staining in both transgenic strains (E, F). De-repression of EGFP by IPTG is found in T152ALacIR mice after 14 days (I, K), but not in T202SLacIR mice (J, L). (K) Group data (left to right): n = 7, 12, 7, 4, 5, 7, 5 mice. (L) Group data (left to right): n = 6, 8, 4, 8, 4 mice. *P<0.05 denotes significant difference; ANOVA followed by Bonferonni tests for multiple groups.

