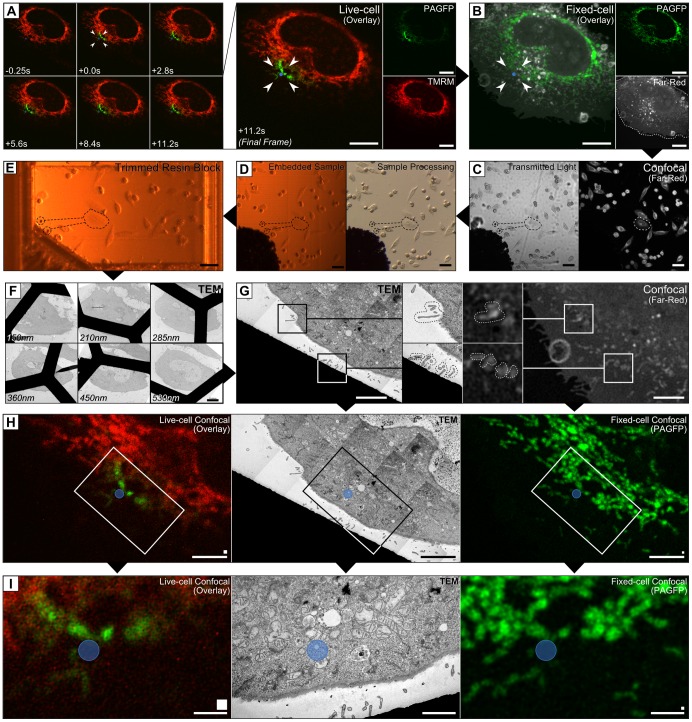
Figure 5. Application of the procedure to investigate mitochondrial photodamage.
(A) HeLa cells on toner-gridded TOPAS were transfected with PAGFP-Mito and stained with TMRM, CellMask Deep-Red and DRAQ5 before live-cell imaging. A 1.2 µm diameter region (arrowheads) within a cell was photo-irradiated prior to fixation. (B) After reactivating the PAGFP, the cell was optically sectioned and (C) neighbouring toner particles were imaged to define the position of the cell (dashed black lines). (D) The target region was cut from the TOPAS by scalpel for processing and resin embedding, using the reference grid to guide extraction. (E) Toner particles were used to guide targeted trimming of the resin block, which was then sectioned (F) to the depth identified from the optical data. (G) The TEM data was spatially aligned using intrinsic cellular features identified by optical imaging (dotted lines in enlarged insets). (H–I) The spatially aligned data is shown with the photoirradiated region indicated by a blue circle. (Scalebars: A,B,F = 10 µm; C,D,E = 50 µm; G,H = 5 µm; I = 2 µm. Original pixel sizes are indicated by squares above the scalebars: H = 10×10 pixels; I = 5×5 pixels).

