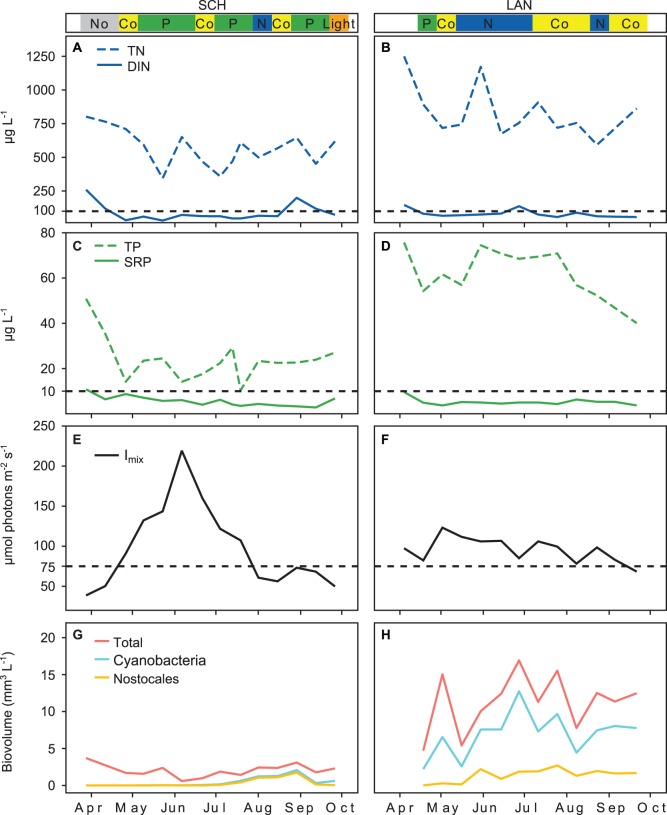
Figure 5. Seasonal pattern of nutrient concentration, Imix and phytoplankton biovolume measured in SCH and LAN (2011).
The colored bands above the graphs indicate the limitation type identified by the bioassays: where No is no limitation; Co is simultaneous or independent co-limitation; P is serial or single P limitation; N is serial or single N limitation; Light is light or co-limitation between light and nutrients. A–D) TN, DIN, TP and SRP; the horizontal lines mark the DIN and SRP concentrations below which N or P limitation are possible according to Maberly et al. [41]. E and F) Imix, the horizontal line marks the light intensity below which in situ light treatments were conducted in the bioassays. G and H) Phytoplankton biovolume estimated according to Utermöhl [33].

