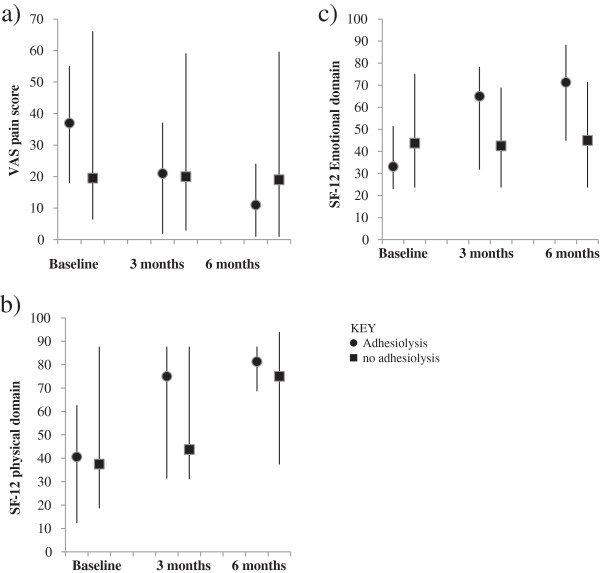
Figure 2.
VAS and SF-12 scores in women with and without adhesiolysis. a Graph indicates VAS scores in women with adhesiolysis and no adhesiolysis at baseline, 3 months and 6 months. Negative change indicates improvement. 2b and c. Graph indicates SF-12 (physical and emotional domain) in women with adhesiolysis and no adhesiolysis at baseline, 3 months and 6 months. Positive change indicates improvement. Negative change indicates decline. The bars represent the interquartile range.

