Figure 2.
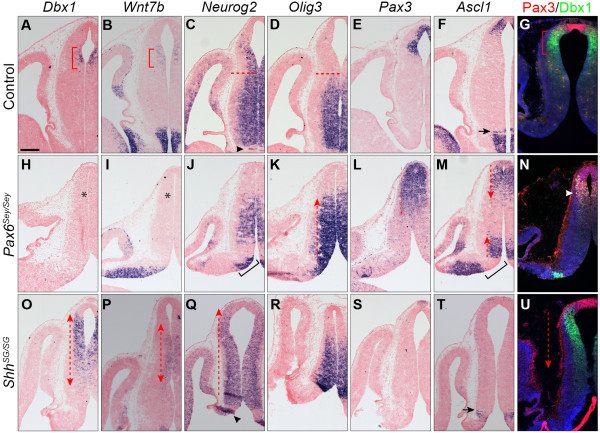
Pattern formation of the diencephalon in embryos without Pax6 or with reduced Shh signaling. (A-F, H-M, and O-T) ISH on adjacent coronal sections of E12.5 embryos. Probes and genotypes are indicated on the top and left of the panel. (G, N, and U) Immunofluorescence for Dbx1 and Pax3 on coronal sections of E12.5 embryos. Red dashed lines in C and D demarcate the border between the epithalamus and the thalamus; dashed line arrows indicate the expansion of the particular progenitor domain; black arrowheads and brackets in C, J, Q and M show the normal and the expanded ZLI, respectively; black arrows in F and T indicate the rTh domain; red brackets demarcate the prospective habenular domain; white arrowheads in N show cells positive for both Dbx1 and Pax3. Note that the apparent lack of transcripts of Pax3 and Asc1 in the pretectum in S and T is due to an anteriorly tilted sectioning plane. Scale bar in (A): 200 μm (A-F, H-M, and O-T); 241 μm (G, N, and U). E, embryonic day; ISH, in situ hybridization; rTh, rostral thalamic; ZLI, zona limitans intrathalamica.

