Figure 2.

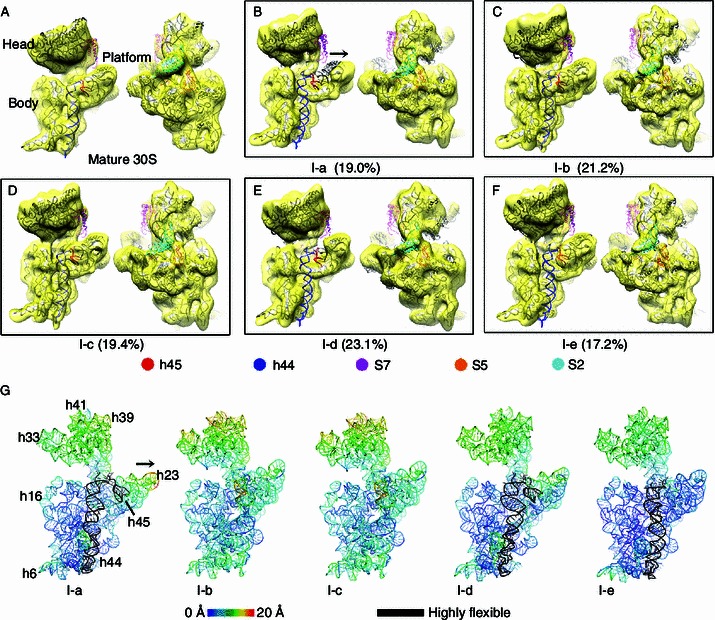
Cryo-EM structures of low salt treated∆rbfA∆rsgAimmature 30S subunits. Density maps of the mature 30S (A) and low salt treated immature 30S subunits (B–F) are superimposed with the atomic model of the mature 30S subunit and displayed from both intersubunit and solvent views. h45, h44, S7, S5 and S2 are colored in red, blue, magenta, orange and cyan, respectively. Particle ratio of each structure is shown. (G) Distance deviations of the 16S rRNA in the five immature 30S structures from that of the mature 30S subunit are displayed as temperature maps, colored according to the scale bar. The highly flexible helices, such as h44 and h45 are colored black. Open conformation of the platform region in I-a is indicated by a black arrow (B and G)
