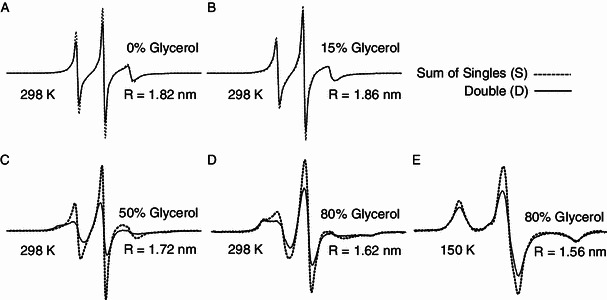
Figure 2.

Distance measurements between two labelled spin radicals in T4 lysozyme. EPR spectra of S90R1 and S117R1 of T4L with different concentrations of glycerol at physiological temperature (298 K, A, B, C, D) and at low temperature (150 K, E). The light dotted line shows the sum of the singly-labeled sample spectra. The thick line shows the spectrum of the doubly-labeled sample normalized to the same number of spins as the corresponding summed singly-labeled spectra. All spectra were recorded using a 200-G scan width. The calculated distances are shown
