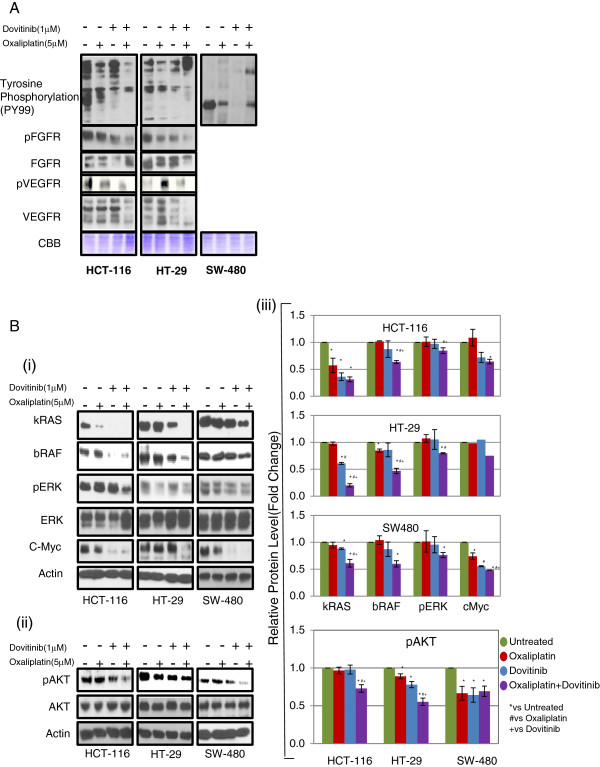
Figure 2.
Effect of dovitinib and/or oxaliplatin on MAP Kinase and PI3Kinase pathway. Western blot analysis of phosphorylation levels after treatment with combination of dovitinib and oxaliplatin in colon cancer cell lines. The cells were starved for 24 h followed by treatment with 10 ng/ml FGF for 30 min prior to the addition of either of the drugs for 24 h. (A) Representative protein bands for tyrosine phosphorylation (py99), p-FGFR and pVEGFR. pFGFR and pVEGFR expression levels were decreased at 24 h after treatment. Coommassie blue (CBB) was used to show equal protein loading in each lane. (B) Representative protein bands for kRAS, bRAF, pERK, ERK and cMyc (i) and pAKT and total AKT (ii) signaling pathways. β-actin was used to show equal protein loading in each lane. (iii) Bar diagram (Mean ± SEM) showing the fold change in the intensity of proteins with respect to b-actin and normalized to untreated group.  = 3; *#+
 < 0.05, vs Untreated, # vs Oxaliplatin and + vs Dovitinib respectively. Combination of dovitinib and oxaliplatin show more pronounced inhibition in expression of proteins involved in MAP kinase and PI3Kinase pathway.

