Figure 3.
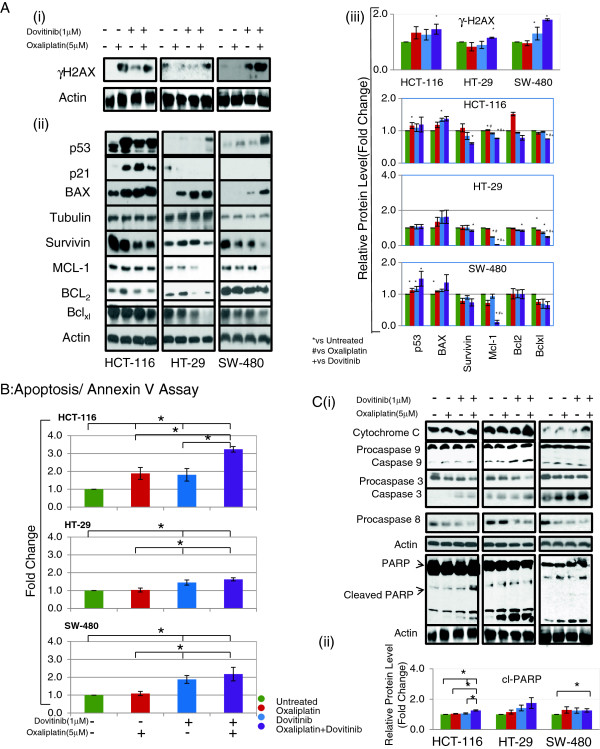
Effect of dovitinib and/or oxaliplatin onset of tumor cell apoptosis and caspases activation. Western blot analysis of DNA damage and proteins involved in apoptotic pathway after treatment with combination of dovitinib and oxaliplatin in colon cancer cell lines (A) Expression of γH2AX (i) and p53, BAX, Blc-2, Bclxl, Mcl-1 and survivin at 24 h after treatment (ii). γ-tubulin or β-actin was used to show equal protein loading of each lane. (iii) Bar diagram (Mean ± SEM) showing the fold change in the intensity of proteins with respect to β-actin or γ-tubulin and normalized to untreated group.
 = 3; *#+
 < 0.05, vs Untreated, # vs Oxaliplatin and + vs Dovitinib respectively. (B) Cell cycle analysis: approximately one million cells before and after treatment with dovitinib and/or oxaliplatin for 48 h. Cells were harvested, stained with annexin V–FITC and/or propidium iodide and subjected to flow cytometric analysis. The percentage of annexin V–FITC positive cells were determined by calculating the ratio to the total number of cells. Each bar represents the Mean ± SEM of at least three independent experiments, *p < 0.05. (C) Induction of caspases cascade and PARP after treatment with dovitinib and/ or oxaliplatin (i). Bar diagram (Mean ± SEM) showing the fold change in the intensity of cleaved PARP with respect to β-actin and normalized to untreated group.
 = 3; *
 < 0.05 (ii). Combination of dovitinib and oxaliplatin show up-regulation of proapoptotic and down-regulation of antiapoptotic proteins via caspases dependent apoptotic pathway.

