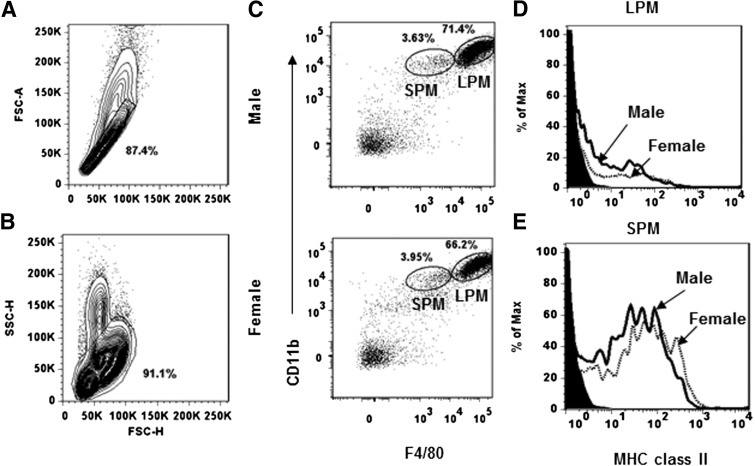
Figure 1. Phenotypic analysis of peritoneal macrophage populations in naïve male and female SJL mice.
Peritoneal cells from naïve male and female mice analyzed by flow cytometry. (A) Forward scatter-height (FSC-H) versus forward scatter-area (FSC-A) plot, demonstrating the gating used for analysis. (B) Forward scatter-height versus side scatter-height (SSC-H) plot demonstrating gating on nongranular cells. (C) Macrophage subsets were identified after gating out CD19+ cells as: CD11b+F4/80hi LPM and CD11b+F4/80lo SPM. (D and E) MHC class II expression on LPM and SPM from males and females. Filled histograms represent isotype controls, and solid lines and dotted lines represent data from males and females, respectively. Data are representative of greater than three experiments.

