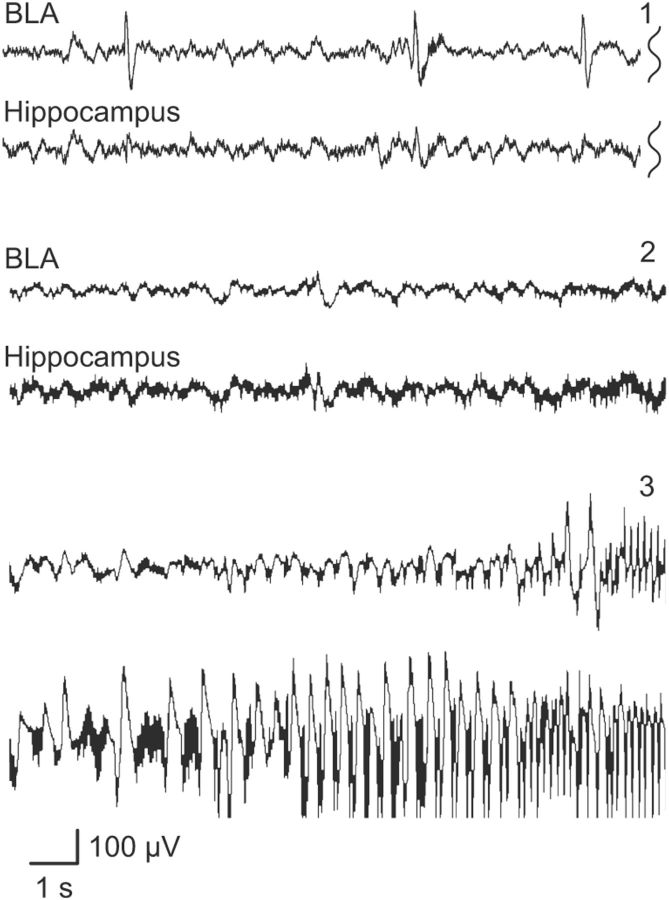
Figure 4.
Sample EEG traces recorded from the right BLA and the right hippocampus in a wild-type mouse during slow infusion of ATPA (25 mm at 0.031 ml/min via lateral tail vein). Traces labeled 1, 2, and 3 are EEG segments that occurred in consecutive order during the infusion; traces 2 and 3 are continuous. BLA trace 1 illustrates the early initiation of sharp wave activity not obtained in the hippocampal recording. A silent period (traces 2) is followed by the initiation of seizures activity in the hippocampus and then with a delay in the BLA (traces 3). Recordings are with respect to a reference electrode placed above the cerebellum.

