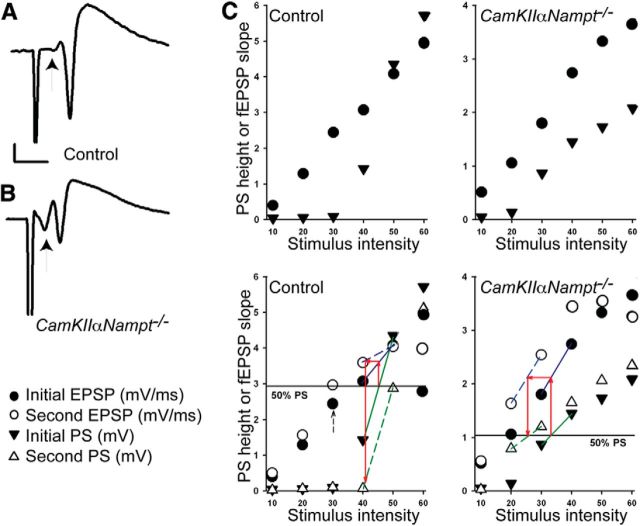
Figure 5.
CaMKIIαNampt−/− mice show altered Schaffer-collateral pathway physiology at 2–3 months of age. A, Representative fEPSPs obtained from control mice show a small presynaptic volley (arrow) relative to the population spike (n = 5). Calibration: 1 mV, 5 ms. B, Representative fEPSPs obtained from CaMKIIαNampt−/− mice show a large presynaptic volley (arrow) relative to the population spike (n = 5). C, Assessment of PS amplitude (height) upon paired-pulse stimulation. Because both dendritic fEPSPs and PS height are altered by paired-pulse stimulation, we used an analysis of IO curves to calculate the size of fEPSP required to generate a half-maximal PS after the first (top) and second (bottom) paired stimuli. The IO curves of the first stimuli in the top are repeated in the bottom for clarity. The left graphs show typical IO curves for dendritic fEPSPs (circles) and PSs (triangles) in a slice from a control mouse. The stimulus intensity needed to evoke a half-maximal PS by the first stimulation (top) was determined by the intersection of the horizontal 50% maximal line with a line connecting the two points straddling the half maximal value (shown by the green solid line between two PS points in black triangles in bottom). We then used this value to calculate the size of dendritic fEPSP required to generate a PS of this magnitude, shown as the intersection of the upward red arrow and the solid blue line connecting two points (black circles), on the initial fEPSP IO curve. We next calculated the stimulus intensity required for the second (paired) stimulus to induce an equivalent fEPS, shown as a horizontal red arrow intersecting the dotted blue line, from the second pulse fEPSP curve (white circles). At this stimulus intensity, we could then determine the PS amplitude generated by the second stimulation, shown as a downward red arrow intersecting the dotted green line on the second PS curve (white triangle). This analysis shows that the PS generated by a second stimulation at an equivalent fEPSP size is much smaller than the PS produced by the initial stimulus, indicating the presence of significant paired-pulse depression. The right graphs show a similar analysis of IO curves in a slice from a CaMKIIαNampt−/− mouse. The marked paired-pulse depression of PS amplitude observed in the control slice is not seen in the CaMKIIαNampt−/− mouse, despite clear paired-pulse potentiation of dendritic fEPSPs, manifest as a leftward shift in the fEPSP IO curves (black vs white circles). The dashed arrow in the lower left graph depicts the 50% maximal fEPSP; this stimulus intensity was used to monitor fEPSPs in LTP studies.

