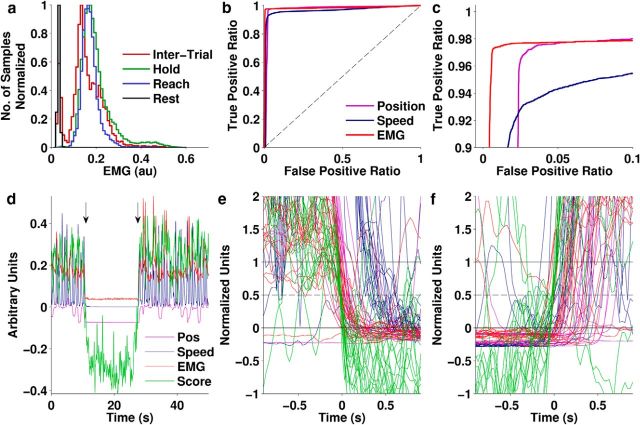
Figure 11.
Relationship of the Idle state to speed, position, and EMG from one Monkey C session. a, Histogram of EMG power for each task state. b, c, ROC curves for predicting the Idle state from vertical position, speed, or EMG power (c is a zoomed-in version of b to show the detail in the top left part of the curve). Dashed line indicates expected performance of a random classifier. d–f, LDA score, speed, vertical position, and average EMG power during transitions into and out of the Idle state. d, Example data showing two transitions (arrows), the first into and the second out of the Idle state. The four quantities were arbitrarily scaled to put them approximately in the same range for plotting. e, f, Normalized values of the same four quantities showing multiple transitions into (e) and out of (f) the Idle state aligned on the time when the normalized LDA score crossed a threshold of 0.5. Normalization mapped the 95th percentile of Idle period values to 0 and the 5th percentile of Active period values to 1 (Equation 12).

