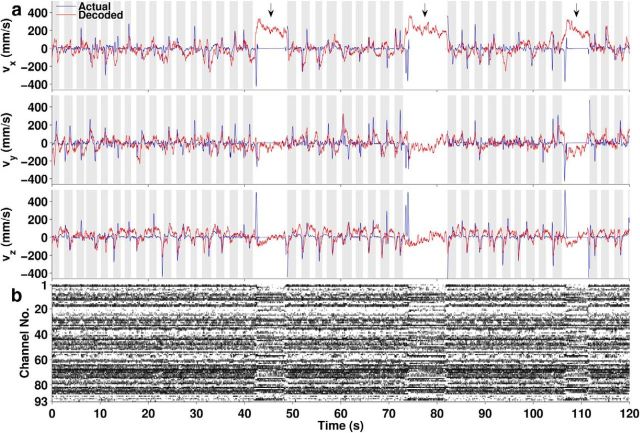
Figure 4.
Kinematics and neural signals over a continuous 2 min period. a, x, y, and z components of decoded hand velocity with the D1 decoder (red) generally follow actual hand velocity (blue) during the 37 trial periods (gray background) and most of the IT periods (white background), except for large deviations during some long IT periods (arrows). The hand marker was out of view during the second long IT period. b, Firing rates (grayscale where white = zero, black = maximum) of the 93 simultaneously recorded units that were used for decoding, aligned in time with the plots in a.

