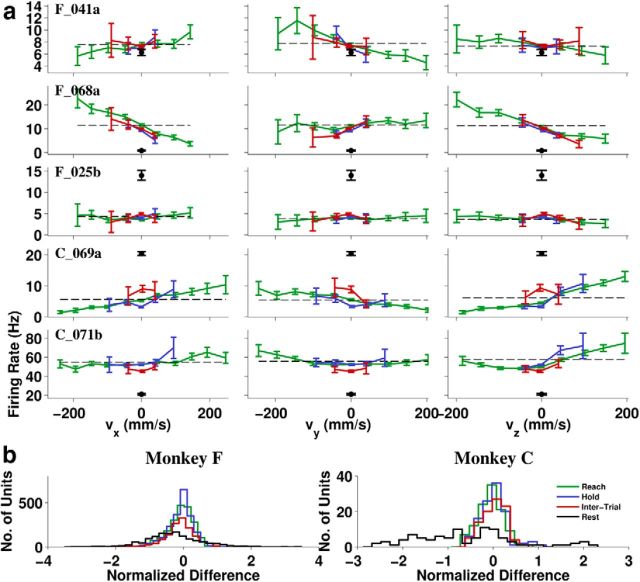
Figure 7.
Single-unit tuning functions. Colors indicate task periods as defined in Figure 1b. a, Binned firing rate plots for each of the four task periods for five representative units: three from Monkey F (top three rows) and two from Monkey C (bottom two rows). Colors indicate task periods defined in Figure 1b and the black dot is the mean firing rate during Rest. Error bars indicate ± 2 SE. Baseline firing rate b0 (dashed line) is shown from a linear fit to Reach period data. b, Histogram of the normalized zero-bin firing rate difference (f0 − b0)/, where f0 is the mean firing rate of a given unit in the zero-velocity bin for a given dimension, b0 is the same as above, and n is the variance of firing rates in 300 ms bins calculated separately and then averaged over the four task periods.

