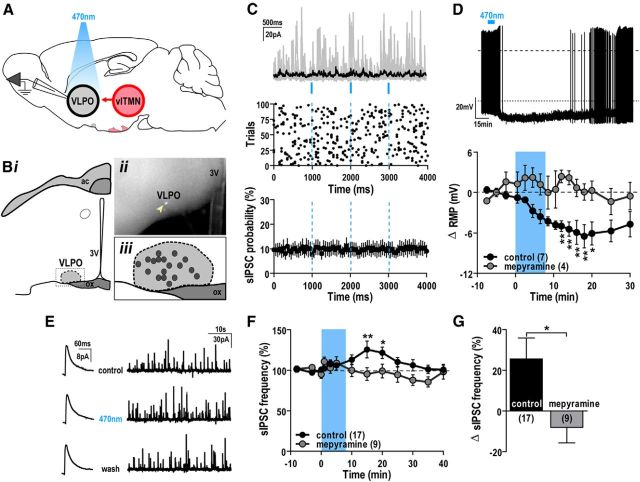
Figure 2.
Photostimulation of histaminergic projections increases GABAergic input to VLPO neurons. A, Schematic of experimental design. Patch-clamp recordings from VLPO neurons during photostimulation of ChR2-expressing histaminergic projections with 3 × 10 ms light pulses over 3 s, repeated every 5 s for 100 trials. B, Distribution of neurons recorded in the VLPO. Schematic of VLPO-containing brain slice (i); brightfield photomicrograph showing a recorded LuciferYellow-filled cell (arrowhead; scale bar, 200 μm, ii); distribution of 18 recorded VLPO neurons (iii). ac, Anterior commissure; ox, optic chiasm; 3V, third ventricle. C, Photostimulation of ChR2-expressing TMN axons did not evoke synchronized GABAergic IPSCs in VLPO neurons. Overlay of individual (gray) and averaged current traces (black) with photostimulation (Vh = −5 mV; top). Raster plot of sIPSC events (middle). No change in VLPO sIPSC probability with each light pulse (n = 15; bottom). All show the lack of light-synchronized GABAergic events in VLPO neurons (100 trials, 50 ms bins). D, Photostimulation of ChR2-expressing histaminergic axons suppressed firing and hyperpolarized VLPO neurons via H1 receptors. Sample trace of action potential inhibition and resting membrane potential (RMP) hyperpolarization of a VLPO neuron after photostimulation of histaminergic inputs (dashed line, 0 mV; dotted line, RMP; top). Mean RMP change of VLPO neurons after photostimulation in control ACSF and 1 μm mepyramine (bottom). E–G, Photostimulation of ChR2-expressing TMN axons increased sIPSC frequency in VLPO neurons via H1 receptors. Representative averaged sIPSCs (200 events; left) and current traces (45 s; right) recorded in a VLPO neuron (E) in ACSF (control), during (470 nm), and after photostimulation (wash). Time course of sIPSC frequency change (% baseline; F) and mean difference in sIPSC frequency (G) after photostimulation in control and 1 μm mepyramine (Vh = −5 mV). Photostimulation is indicated by blue bars/dashed lines. D, F, *p < 0.05; **p < 0.01 (RM-ANOVA, Bonferroni post hoc test). G, *p < 0.05 (unpaired t test).

